

Automate Predictive Maintenance with AppSheet and Gemini AI


Unplanned downtime is more than a production halt; it’s a financial crisis whose hidden costs cascade through your entire organization.
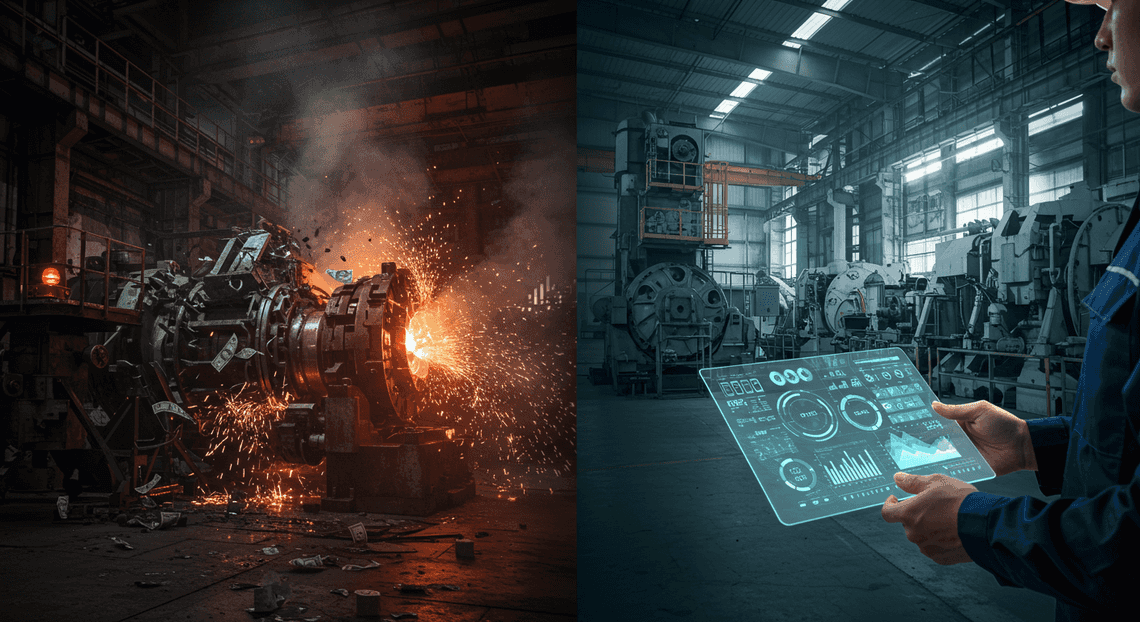
The High Cost of Unplanned Downtime in Industrial Operations
In the relentless rhythm of industrial operations, silence is rarely golden. The sudden halt of a critical production line, the unexpected failure of a key piece of machinery—this is the sound of profits evaporating. Unplanned downtime isn’t just an inconvenience; it’s a multi-faceted crisis that cascades through an organization, leaving a trail of tangible and intangible costs.
Consider the immediate financial hemorrhage:
-
Lost Production: Every minute the line is down translates to lost output and unfulfilled orders.
-
Labor Costs: You’re paying skilled operators and technicians to stand by or engage in frantic, often overtime-heavy, emergency repairs.
-
Repair and Replacement: Emergency procurement of parts and specialized equipment comes at a premium.
But the damage runs deeper than the immediate balance sheet. There are the hidden costs that erode long-term stability: supply chain disruptions that damage partner relationships, missed delivery deadlines that tarnish your company’s reputation, and most critically, the potential for catastrophic safety incidents when equipment fails under stress. For decades, the prevailing wisdom was to simply absorb these costs as an unavoidable part of doing business. That era is over.
Moving from a Reactive to a Predictive Maintenance Model
To understand the solution, we must first appreciate the evolution of maintenance strategy. Most organizations exist somewhere on a spectrum, often stuck in inefficient and costly stages.
-
**Reactive Maintenance: This is the “if it ain’t broke, don’t fix it” approach. Maintenance is only performed after a failure has occurred. It’s pure firefighting—a chaotic, high-stress model that maximizes downtime and incurs the highest possible repair costs. It’s the most expensive and dangerous way to manage assets.
-
Preventive Maintenance: A significant step up, this model operates on a fixed schedule. You service a machine every 1,000 hours of operation or replace a part every six months, regardless of its actual condition. While this reduces unexpected failures, it’s profoundly inefficient. You either perform “too early” maintenance, discarding perfectly good components and wasting technician time, or “too late” maintenance, where the component fails before its scheduled service date, plunging you right back into a reactive crisis.
-
Predictive Maintenance (PdM): This is the paradigm shift. Instead of relying on schedules or waiting for disaster, predictive maintenance uses real-time operational data—vibration, temperature, pressure, technician notes, error codes—to forecast when a piece of equipment is likely to fail. Maintenance is then scheduled precisely when needed: just before the failure occurs. This model minimizes downtime, eliminates unnecessary maintenance, extends asset life, and optimizes the use of spare parts and labor. It transforms maintenance from a cost center into a strategic advantage.
Until recently, implementing a true PdM system was the exclusive domain of enterprises with deep pockets, dedicated data science teams, and complex IT infrastructure. That barrier is now being dismantled.
Introducing a Low-Code AI-Powered Solution for Operations Leads
What if you could build a sophisticated predictive maintenance system without writing a single line of code? What if the insights from advanced AI could be put directly into the hands of the maintenance supervisors and operations leads on the factory floor?
This is the promise of combining a low-code platform like AI-Powered Invoice Processor with the powerful analytical capabilities of Gemini AI. This isn’t a theoretical concept; it’s a practical toolkit for operational excellence.
-
AMA Patient Referral and Anesthesia Management System acts as the frontline data-gathering and workflow engine. Imagine your technicians using a simple app on their phone or tablet to log inspection data, upload photos of wear and tear, record sensor readings, and even dictate notes about unusual machine behavior. This data, once trapped in paper logs or disparate spreadsheets, becomes structured, centralized, and instantly accessible.
-
Gemini AI serves as the intelligent brain of the operation. It can analyze the rich stream of data collected by AppSheetway Connect Suite—from numerical sensor data to the nuances of a technician’s written observations—to identify subtle patterns and correlations that precede a failure. It can answer a simple prompt like, “Based on the last three months of vibration data and inspection notes for Pump-07B, what is the probability of a bearing failure in the next 30 days?”
This combination democratizes predictive maintenance. It empowers the very people who understand the equipment best to build and manage a system that anticipates problems, transforming them from reactive firefighters into proactive strategists.
Solution Architecture: A High-Level Overview
Before we dive into the nuts and bolts, let’s zoom out and look at the blueprint for our automated predictive maintenance system. The beauty of this architecture lies in its elegant simplicity and its reliance on the tightly integrated [Automatically create new folders in Google Drive, generate templates in new folders, fill out text automatically in new files, and save info in [Automated Web Scraping with [Multilingual Text-to-Speech Tool with SocialSheet Streamline Your Social Media Posting 123](https://votuduc.com/Multilingual-Text-to-Speech-Tool-with-Google-Workspace-p809282)](https://votuduc.com/Automated-Web-Scraping-with-Google-Sheets-p292968)](https://workspace.google.com/marketplace/app/auto_create_folder_and_files/430076014869) ecosystem, supercharged by the analytical power of Gemini AI. Each component has a distinct role, working in concert to transform raw operational data into actionable, proactive alerts.
The data journey follows a clear, four-step flow:
-
Capture: Field technicians log equipment data using a simple OSD App Clinical Trial Management mobile app.
-
Aggregate: This data is instantly stored and organized in a central Google Sheet.
-
Forecast: A [AI Powered Cover Letter [Automated Job Creation in Real Time Jobber and Google Sheets Integration from Gmail](https://votuduc.com/Automated-Job-Creation-in-Jobber-from-Gmail-p115606) Engine](https://votuduc.com/AI-Powered-Cover-Letter-Automated Quote Generation and Delivery System for Jobber-Engine-p111092) periodically sends the aggregated data to the Gemini API for analysis and failure prediction.
-
Alert: AppSheet Automated Work Order Processing for UPS monitors the AI-generated predictions and triggers push notifications when a high failure risk is detected.
Let’s break down each stage of this process.
Data Capture: Capturing Equipment Runtime with AppSheet
The entire process begins at the source: the machinery on your factory floor, in the field, or at a client site. Our first component is a purpose-built AppSheet application designed for maximum simplicity and reliability for the technicians who use it.
This mobile-first app serves as the primary interface for data entry. A technician can quickly select a piece of equipment (perhaps by scanning a QR code), enter its latest runtime hours from the meter, and add any observational notes (e.g., “unusual vibration,” “minor fluid leak”). AppSheet handles the rest, automatically timestamping the entry and capturing the user’s identity. The key advantage here is structured, validated data capture. We eliminate the ambiguity of paper logs or unstructured emails, ensuring the data fed into our AI model is clean and consistent from the very start. Thanks to AppSheet’s offline capabilities, data can be logged even in environments with poor connectivity and synced later.
Data Aggregation: Using Google Sheets as the Central Hub
Once a technician saves an entry in the AppSheet app, the data doesn’t just sit on their device. It is immediately written as a new row in a designated Google Sheet. This Sheet acts as the central nervous system for our solution—a simple, scalable, and accessible data repository.
Think of this Google Sheet as the definitive historical log for your equipment. Each row represents a single data point: Equipment ID, Date, Runtime Hours, Technician Notes, and so on. This chronological record is crucial, as it forms the dataset that Gemini will analyze to identify subtle patterns and trends that precede a failure. By using Google Sheets as our backend, we leverage a familiar tool that is seamlessly integrated with both our data capture front-end (AppSheet) and our AI analysis engine (via Apps Script).
AI Forecasting: Leveraging the Gemini API for Failure Pattern Analysis
This is where the magic happens. While Google Sheets stores the what and when, Gemini AI determines the what next. The bridge between our data and the AI is Genesis Engine AI Powered Content to Video Production Pipeline, a powerful scripting platform that lives within the AC2F Streamline Your Google Drive Workflow environment.
Here’s the workflow:
-
Scheduled Trigger: A time-driven trigger in [Architecting Multi Tenant AI Workflows in Building Modular Agentic Apps Script with Gemini Function Calling](https://votuduc.com/architecting-multi-tenant-ai-workflows-in-google-apps-script-p-20260321290501) executes a function automatically (e.g., once every 24 hours).
-
Data Retrieval: The script reads the historical runtime data for each piece of equipment from our Google Sheet.
-
[Prompt Engineering for Reliable Autonomous Workspace Agents for Reliable Autonomous Workspace Agents](https://votuduc.com/prompt-engineering-for-reliable-autonomous-workspace-agents-p-20260319404106): It then formats this data into a carefully constructed prompt for the Gemini API. This prompt doesn’t just dump the data; it asks a specific question, such as: “Given the following time-series data of runtime hours and technician notes for Hydraulic Pump XYZ-789, analyze the patterns and predict the probability of mechanical failure within the next 200 hours of operation. Return a probability score and a brief justification for your analysis.”
-
API Call & Analysis: The script sends this prompt to the Gemini API. Gemini processes the historical data, identifying correlations and anomalies invisible to the human eye—like a slight acceleration in runtime accumulation or a correlation between certain notes and past failures.
-
Write-Back: The script receives the AI’s response (e.g., a 92% failure probability and a justification like “Irregular runtime spikes combined with notes on ‘vibration’ indicate imminent bearing failure”), parses it, and writes the prediction and justification back into new columns in our Google Sheet, right alongside the equipment data.
Proactive Alerting: Closing the Loop with AppSheet Push Notifications
An AI prediction is only valuable if it drives action. The final step in our architecture closes the loop, turning Gemini’s insight into a timely, actionable task for the maintenance team. We achieve this using AppSheet’s built-in automation capabilities.
We configure an [Architecting Autonomous Data Entry Apps with AppSheet and Building Self-Correcting Agentic Workflows with Vertex AI](https://votuduc.com/architecting-autonomous-data-entry-apps-with-appsheet-and-vertex-ai-p-20260322535129) “Bot” that constantly monitors our Google Sheet for changes. The bot is configured with a simple event-based trigger: “When a row is updated in the ‘Predictions’ column and the ‘Failure Probability’ is greater than 0.85…”.
When this condition is met, the bot executes a predefined process: send a push notification directly to the maintenance manager’s mobile device. This isn’t a generic alert; it’s a rich, context-aware notification crafted from the data in the sheet:
“High Failure Alert: Pump XYZ-789 has a 92% predicted failure probability. AI Justification: ‘Irregular runtime spikes combined with notes on ‘vibration’ indicate imminent bearing failure.’ Tap to create a work order.”
With a single tap, the manager can be taken directly to a view in the AppSheet app to schedule an inspection, effectively preventing downtime before the failure ever occurs.
Step-by-Step Implementation Guide
This section provides a detailed walkthrough for building the automated predictive maintenance system. We will configure the data capture mechanism in AppSheet, structure the backend data in Google Sheets, write the core AI logic in Automating Technical Debt Audits in Apps Script with AI Agents, and finally, create the feedback loop with automated triggers and alerts.
Step 1: Configuring Your AppSheet App for Data Collection
The foundation of any predictive model is clean, consistent data. Our AppSheet application will serve as the primary interface for field technicians to log machine health metrics.
-
Start with Data: Create a new Google Sheet. Rename the first tab to
MachineReadings. This will be the data source for your app. -
Define the Schema: Set up the following columns in the
MachineReadingssheet:
-
ReadingID: A unique identifier for each entry. -
Timestamp: The exact date and time of the reading. -
MachineID: An identifier for the specific piece of equipment (e.g., “PUMP-001”, “HVAC-03B”). -
Temperature: The operating temperature (numeric value). -
Vibration: The vibration level (numeric value, e.g., in mm/s). -
Pressure: The operating pressure (numeric value, e.g., in PSI). -
OperatorNotes: A text field for any qualitative observations. -
Status: The current operational status.
- Create the AppSheet App:
- Navigate to AppSheet and create a new app, starting with your existing data from the Google Sheet you just created.
AppSheet will automatically generate a basic app. Go to the* Data > Columns** tab for the MachineReadings table.
- Configure Column Types and Constraints: Fine-tune the data schema within AppSheet for robust data entry.
-
ReadingID: Set the type to
Text. In its settings, use the formulaUNIQUEID()as the Initial value to ensure every entry has a unique key. -
Timestamp: Set the type to
DateTime. UseNOW()as the Initial value to auto-populate the current time when a new form is opened. -
MachineID: Set the type to
Refif you have a separateMachinestable, orEnumwith a predefined list of machines to prevent typos. -
Temperature, Vibration, Pressure: Ensure these are set to
DecimalorNumber. You can set valid ranges using the Valid_If constraint to prevent erroneous entries (e.g.,AND([_THIS] > 0, [_THIS] < 200)). -
OperatorNotes: Set the type to
LongText. -
Status: Set the type to
Enum. Create a list of values such as “Operational”, “Needs Inspection”, “Under Maintenance”.
- Build the User Interface (UX):
AppSheet will likely create a default form view for data entry. Customize this view under the* UX** tab to be intuitive for a technician.
- Ensure the form is simple and logically ordered. Technicians in the field need to log data quickly and accurately.
At this point, you have a functional mobile app for capturing structured time-series data directly into your Google Sheet.
Step 2: Structuring Your Google Sheet for Time-Series Analysis
A well-organized backend is critical for separating raw data from AI-generated insights. This prevents data corruption and simplifies the logic in our script.
In your Google Sheet workbook, create a second tab and name it AnalysisLog. This sheet will not be connected to AppSheet directly for editing but will store the output from Gemini.
Sheet 1: MachineReadings (Managed by AppSheet)
This sheet remains as configured in Step 1. It is the single source of truth for raw, operator-submitted data.
| ReadingID | Timestamp | MachineID | Temperature | Vibration | Pressure | OperatorNotes | Status |
| :--- | :--- | :--- | :--- | :--- | :--- | :--- | :--- |
| a1b2c3d4 | 10/26/2023 14:30 | PUMP-001 | 85.5 | 2.1 | 150.2 | Normal operation | Operational |
| … | … | … | … | … | … | … | … |
Sheet 2: AnalysisLog (Managed by Google Apps Script)
This sheet will store the results of our predictive analysis.
-
Columns to create:
-
AnalysisID: A unique ID for each analysis run, generated by the script. -
AnalysisTimestamp: When the analysis was performed. -
MachineID: The machine that was analyzed. -
DataPointsAnalyzed: The number of recent readings used for the prediction. -
PredictionText: The raw text response from the Gemini AI model. -
FailureRisk: A categorized risk level extracted from the prediction (e.g., “Low”, “Medium”, “High”). -
RecommendedAction: A specific action suggested by the AI.
| AnalysisID | AnalysisTimestamp | MachineID | DataPointsAnalyzed | PredictionText | FailureRisk | RecommendedAction |
| :--- | :--- | :--- | :--- | :--- | :--- | :--- |
| … | … | … | … | … | … | … |
This two-sheet structure decouples the system: AppSheet writes to MachineReadings, and the Apps Script reads from MachineReadings and writes to AnalysisLog. This separation is a robust design pattern that prevents race conditions and makes debugging significantly easier.
Step 3: Building the Google Apps Script to Connect Sheets and Gemini
This is the intelligent core of our system. The Google Apps Script will act as the middleware, fetching data from our sheet, constructing a prompt, querying the Gemini API, and logging the response.
-
Open the Script Editor: In your Google Sheet, go to Extensions > Apps Script.
-
Store Your API Key Securely: Never hardcode your API key. Use Apps Script’s
PropertiesServiceto store it securely.
Go to* Project Settings** (the gear icon ⚙️).
Scroll down to* Script Properties** and add a property.
-
Property name:
GEMINI_API_KEY -
Value: Your actual Gemini API key from Google AI Studio.
- Write the Script: Replace the default code in
Code.gswith the following. This script contains the primary function to fetch data, call the Gemini API, and parse the response.
// The ID of your Google Sheet

const SPREADSHEET_ID = 'YOUR_SPREADSHEET_ID'; // Replace with your actual Sheet ID

const RAW_DATA_SHEET_NAME = 'MachineReadings';

const ANALYSIS_LOG_SHEET_NAME = 'AnalysisLog';

const NUM_RECORDS_TO_FETCH = 20; // How many recent data points to send to the model

/**

* Main function to be called by an AppSheet trigger.

* It orchestrates the process of fetching data, calling Gemini, and logging the analysis.

* @param {string} machineId The ID of the machine to analyze.

*/

function runPredictiveAnalysis(machineId) {

try {

const machineData = getLatestMachineData(machineId);

if (machineData.length === 0) {

Logger.log(`No data found for machine: ${machineId}`);

return;

}

const prompt = buildPrompt(machineId, machineData);

const geminiResponse = callGeminiAPI(prompt);

const parsedResponse = parseGeminiResponse(geminiResponse);

logAnalysisResult(machineId, machineData.length, geminiResponse, parsedResponse);

} catch (error) {

Logger.log(`Error in runPredictiveAnalysis: ${error.toString()}`);

}

}

/**

* Fetches the last N records for a specific machine from the MachineReadings sheet.

* @param {string} machineId The ID of the machine.

* @return {Array<Object>} An array of data objects.

*/

function getLatestMachineData(machineId) {

const sheet = SpreadsheetApp.openById(SPREADSHEET_ID).getSheetByName(RAW_DATA_SHEET_NAME);

const allData = sheet.getDataRange().getValues();

const headers = allData.shift(); // Remove header row

// Find column indices dynamically

const machineIdCol = headers.indexOf('MachineID');

const timestampCol = headers.indexOf('Timestamp');

const filteredData = allData

.filter(row => row[machineIdCol] === machineId)

.sort((a, b) => new Date(b[timestampCol]) - new Date(a[timestampCol])); // Sort descending by date

const recentData = filteredData.slice(0, NUM_RECORDS_TO_FETCH);

// Convert rows to objects for easier handling

return recentData.map(row => {

let obj = {};

headers.forEach((header, i) => obj[header] = row[i]);

return obj;

});

}

/**

* Constructs the prompt to be sent to the Gemini API.

* @param {string} machineId The machine being analyzed.

* @param {Array<Object>} data The time-series data.

* @return {string} The formatted prompt.

*/

function buildPrompt(machineId, data) {

const dataString = data.map(d =>

`{Timestamp: "${d.Timestamp}", Temp: ${d.Temperature}, Vibration: ${d.Vibration}, Pressure: ${d.Pressure}}`

).join(',\n');

return `

You are a predictive maintenance AI expert for industrial machinery.

Analyze the following time-series data for machine "${machineId}".

The data consists of the last ${data.length} readings (Timestamp, Temperature, Vibration, Pressure).

Data:

[

${dataString}

]

Based on this data, provide a concise analysis in JSON format. The JSON object must contain three keys:

1. "failureRisk": A string value which is one of "Low", "Medium", or "High".

2. "confidenceScore": A number between 0.0 and 1.0.

3. "recommendedAction": A brief, actionable recommendation for a technician (e.g., "Continue standard monitoring.", "Schedule inspection within 7 days.", "Immediate shutdown and inspection required.").

Do not include any text or markdown formatting before or after the JSON object.

`;

}

/**

* Calls the Gemini API with the provided prompt.

* @param {string} prompt The prompt to send.

* @return {string} The raw text response from the API.

*/

function callGeminiAPI(prompt) {

const API_KEY = PropertiesService.getScriptProperties().getProperty('GEMINI_API_KEY');

const API_URL = 'https://generativelanguage.googleapis.com/v1beta/models/gemini-pro:generateContent?key=' + API_KEY;

const payload = {

contents: [{

parts: [{

text: prompt

}]

}]

};

const options = {

method: 'post',

contentType: 'application/json',

payload: JSON.stringify(payload),

muteHttpExceptions: true

};

const response = UrlFetchApp.fetch(API_URL, options);

const responseText = response.getContentText();

const jsonResponse = JSON.parse(responseText);

// Extract the text content from the Gemini response structure

return jsonResponse.candidates[0].content.parts[0].text;

}

/**

* Parses the JSON string from Gemini's response.

* @param {string} responseText The JSON string from Gemini.

* @return {Object} A parsed object with risk and action.

*/

function parseGeminiResponse(responseText) {

try {

// Clean up potential markdown code block formatting

const cleanedText = responseText.replace(/```json\n/g, '').replace(/\n```/g, '');

return JSON.parse(cleanedText);

} catch (e) {

Logger.log(`Failed to parse Gemini response: ${responseText}`);

return { failureRisk: 'Error', recommendedAction: 'Response parsing failed.' };

}

}

/**

* Writes the analysis result to the AnalysisLog sheet.

* @param {string} machineId The machine ID.

* @param {number} dataPoints The number of data points analyzed.

* @param {string} rawResponse The full raw response from Gemini.

** @param {Object} parsedResponse The parsed JSON object.

*/

function logAnalysisResult(machineId, dataPoints, rawResponse, parsedResponse) {

const logSheet = SpreadsheetApp.openById(SPREADSHEET_ID).getSheetByName(ANALYSIS_LOG_SHEET_NAME);

const newRow = [

Utilities.getUuid(), // AnalysisID

new Date(),          // AnalysisTimestamp

machineId,

dataPoints,

rawResponse,

parsedResponse.failureRisk || 'N/A',

parsedResponse.recommendedAction || 'N/A'

];

logSheet.appendRow(newRow);

}
- Deploy the Script: You must deploy the script to allow AppSheet to call it.
Click* Deploy > New deployment**.
Select type* Web app**.
-
In the configuration:
-
Description: “Predictive Maintenance API for AppSheet”
-
Execute as: “Me”
-
Who has access: “Anyone with Google account” (or restrict to your domain).
Click* Deploy**. You will need to authorize the script’s permissions the first time.
Step 4: Setting Up Automated Triggers and Alerts in AppSheet
The final step is to connect AppSheet’s actions to our Google Apps Script and present the results to the user.
- Create an Automation Bot:
In your AppSheet editor, go to the* Automation** tab.
Click* + New Bot**. Name it “Run Predictive Analysis”.
- Configure the Event:
-
Configure the event that will trigger the bot. A good trigger is a new data entry.
-
Event Type:
Data Change -
Table:
MachineReadings -
Data Change Type:
Adds only
You can add a* Condition** to only run the analysis periodically, for example, MOD(HOUR(NOW()), 4) = 0 to run it every 4 hours, or after a certain number of new entries. For this guide, we’ll trigger it on every new entry.
- Create the “Call a Script” Task:
In your bot’s process, add a step. Choose* Call a script**.
-
Select the Google Apps Script project you just deployed.
-
The function name to call is
runPredictiveAnalysis. -
The script will ask for the
machineIdparameter. Pass the value from the newly added row by using the expression[MachineID].
- Display the Analysis Results in the App:
Go back to the* Data** tab in AppSheet.
Add a new table to the app, using your Google Sheet as the source, but this time select the AnalysisLog sheet. Make this table* Read-Only**.
Create a new* View in the UX** tab.
-
View Type:
Dashboard. -
In the dashboard, add a view of the
MachineReadingstable and a view of theAnalysisLogtable. You can set up an interactive dashboard where selecting a machine filters both the readings and the analysis log.
- Create Visual Alerts with Format Rules:
Go to* UX > Format Rules**.
-
Create a new rule named “High Failure Risk Alert”.
-
Table:
AnalysisLog -
Condition:
[FailureRisk] = "High" -
Formatting: Set the text color to red, make it bold, and choose a warning icon.
-
Create similar rules for “Medium” risk (yellow) and “Low” risk (green).
Now, when a technician saves a new reading in the AppSheet app, the automation bot triggers the Google Apps Script. The script fetches the latest data, gets a prediction from Gemini, and logs it. The AnalysisLog table in the app updates automatically, and the format rules immediately highlight any high-risk predictions, providing an instant, actionable insight.
Why Gemini is a Game-Changer for Maintenance Forecasting
Traditional predictive maintenance often relies on rigid, rule-based systems. An alert triggers when a single data point, like temperature or vibration, crosses a pre-defined static limit. While better than reactive maintenance, this approach is fundamentally limited. It’s like a doctor only checking a patient’s temperature to diagnose an illness—it misses the bigger picture.
This is where Gemini changes the entire paradigm. As a natively multimodal large language model, Gemini isn’t just processing numbers; it’s understanding context, identifying relationships, and reasoning across diverse datasets. It can analyze structured sensor telemetry, unstructured text from technician logs, and even images of equipment wear and tear simultaneously. This ability to synthesize information from multiple sources elevates forecasting from simple threshold-breaching to genuine, context-aware prediction.
Beyond Simple Thresholds: Identifying Complex Failure Patterns
The most significant leap forward with Gemini is its ability to move beyond single-variable triggers and identify the subtle, interconnected patterns that precede a failure. A machine rarely fails because one metric suddenly spikes; it fails because a complex interplay of factors has been developing over time.
A simple threshold system would only flag a motor when its vibration exceeds, say, 10 mm/s. It’s a binary, lagging indicator. Gemini, however, can perform a multi-variate analysis in real-time. It can correlate a gradual 15% increase in vibration over three weeks with a 5% increase in current draw and a subtle change in its acoustic signature. Individually, none of these data points would trigger an alarm in a traditional system. Together, they form a distinct failure signature that Gemini can recognize.
Furthermore, Gemini excels at incorporating unstructured data—the goldmine of tribal knowledge often locked away in text fields. It can parse a technician’s note like, “Heard a slight grinding noise during the morning startup cycle, seemed to resolve after 10 minutes,” and connect that human observation to a minor dip in oil pressure recorded at the same time. By learning from these combined data streams, Gemini can identify novel and complex failure patterns that would be impossible to pre-program with simple IF-THEN rules, allowing you to catch failures long before they become critical.
How Gemini Analyzes ‘Mean Time to Failure’ (MTTF)
Mean Time to Failure (MTTF) is a foundational metric in reliability engineering, but its traditional calculation is often a blunt instrument. A historical average MTTF for a specific pump model doesn’t account for the vast differences in its real-world application. A pump running 24/7 in a high-temperature, corrosive environment will have a drastically different lifespan than an identical one used intermittently in a climate-controlled facility.
Gemini transforms MTTF from a static, historical average into a dynamic, predictive forecast tailored to each individual asset. Instead of relying on a single, fleet-wide number, you can use Gemini to calculate a context-aware MTTF.
Here’s how it works:
-
Data Ingestion: Through AppSheet, you feed Gemini not just the asset type, but its specific operational history. This includes real-time sensor data (load cycles, operating hours, temperature), environmental conditions, and detailed maintenance logs (component replacements, repairs performed).
-
Advanced Reasoning: You can prompt Gemini to act as a reliability expert. For example: “Given the operational data and maintenance history for Asset #XYZ-789, forecast its remaining useful life and calculate its dynamic MTTF.”
-
Contextual Output: Gemini doesn’t just spit out a number. It analyzes all the variables and provides a reasoned forecast. It might respond, “Asset #XYZ-789 is operating 20% above its standard load and its last bearing replacement used a component from a batch with a known 5% higher failure rate. Therefore, its projected MTTF is reduced from the standard 8,000 hours to an estimated 6,200 hours. Recommend inspection within the next 400 operating hours.”
This moves your team from planning based on generic averages to making data-driven decisions based on the unique condition and context of each critical piece of equipment.
Making Advanced AI Accessible for Your Operations Team
Perhaps the most revolutionary aspect of integrating Gemini with AppSheet is the democratization of advanced AI. Historically, implementing this level of predictive analysis required a dedicated team of data scientists, expensive ML platforms, and months of model development and training. It was a capability reserved for the largest enterprises.
The AppSheet and Gemini combination shatters that barrier.
-
No-Code Interface: Your operations team interacts with the system through the familiar, user-friendly AppSheet interface they already use for work orders and data entry.
-
Natural Language Prompts: The need for complex coding is replaced by natural language. A maintenance manager doesn’t need to know JSON-to-Video Automated Rendering Engine; they just need to know what question to ask. They can simply type a prompt into a field in their AppSheet app: “Review the last 50 maintenance logs for our fleet of compressors. What are the top 3 recurring failure modes and what is the leading indicator for each?”
-
Actionable Insights, In-App: The magic is that Gemini’s response—a clear, concise summary of failure modes and their indicators—is piped directly back into the AppSheet application. This insight can then trigger an Automating Field Inspection Corrections with AppSheet and Gemini AI to automatically create inspection checklists for those leading indicators, assign them to technicians, and update a central dashboard.
This closes the loop between data, insight, and action. It puts the power of a world-class data science team directly into the hands of your frontline maintenance and reliability professionals, enabling them to make smarter, more proactive decisions without ever leaving the application they use every day.
The Tangible Business Impact of This System
Moving beyond the technical architecture, the true value of this AppSheet and Gemini-powered system is measured in tangible, operational, and financial outcomes. Integrating predictive intelligence directly into your workflow isn’t just an IT project; it’s a fundamental upgrade to your business’s nervous system. It transforms your maintenance strategy from a reactive, cost-intensive function into a proactive, value-driving engine. Let’s break down the specific areas where you’ll see the most significant impact.
Drastically Reducing Equipment Downtime
Unplanned downtime is the silent killer of productivity and profitability. The traditional “run-to-failure” model is incredibly costly, not just in repair expenses but in lost production, missed deadlines, and potential safety hazards. Even standard preventive maintenance, while an improvement, is inefficient—often leading to the replacement of perfectly good components on a fixed schedule, or worse, failing to catch an issue that arises between scheduled checks.
This system introduces a paradigm shift from unplanned stops to planned interventions.
Here’s how it works in practice:
-
Context-Rich Alerts: Gemini isn’t just flagging a sensor reading that crosses a static threshold. It’s analyzing patterns, correlating multiple data streams (e.g., vibration, temperature, and power consumption), and cross-referencing this with historical maintenance logs. The alert you receive in AppSheet isn’t “Temperature is high”; it’s “Vibration anomaly in Spindle B, consistent with historical bearing wear patterns, indicates an 85% probability of failure within the next 72 hours.”
-
From Firefighting to Foresight: This level of specific, actionable intelligence allows you to convert a catastrophic line-stoppage event into a controlled, scheduled repair. You can plan the maintenance during a shift change or a scheduled lull in production. The right parts are ordered, the right technician is assigned, and the entire process is managed efficiently within the AppSheet app.
The cascading benefit is immense. You maintain production throughput, ensure on-time delivery, reduce overtime costs for emergency repairs, and improve overall equipment effectiveness (OEE).
Optimizing Spare Parts Inventory and Maintenance Schedules
A storeroom filled with expensive spare parts is a classic operational dilemma. Too much inventory, and you have capital tied up in depreciating assets. Too little, and you risk extended downtime waiting for a critical component to be shipped. This predictive system allows you to escape this balancing act and move towards a more intelligent “just-in-time, with foresight” inventory model.
-
Data-Driven Procurement: When the system predicts a specific pump’s motor is likely to fail within the next 30 days, it can trigger an automated workflow. The AppSheet app can check current inventory levels for that motor. If it’s not in stock, an approval request for a purchase order can be automatically routed to the appropriate manager. This drastically reduces the need to keep a massive “just-in-case” inventory, freeing up significant capital.
-
Dynamic and Prioritized Scheduling: Forget rigid, calendar-based maintenance schedules where every machine gets checked on the first of the month. Your Building an AI Powered Business Insights Dashboard with AppSheet and Looker Studio becomes a dynamic work-order queue, prioritized by AI-driven risk assessment. Your maintenance team arrives each day and sees a clear, ranked list:
-
Machine A (Press): High Priority - 90% failure probability in < 7 days.
-
Machine C (Conveyor): Medium Priority - 65% failure probability in < 30 days.
-
Machine B (HVAC): Low Priority - Anomaly detected, monitor performance.
This ensures your most valuable resources—your skilled technicians—are always focused on the most critical tasks, maximizing labor productivity and preventing the burnout associated with constant crisis management.
Calculating the ROI on Your Predictive Maintenance Agent
For any business leader, the ultimate question is: “What’s the return on investment?” The beauty of this system is that its ROI is not only high but also remarkably straightforward to calculate. You can build a compelling business case by quantifying the gains against the relatively low costs of a low-code/AI implementation.
Let’s frame the calculation: ROI = (Financial Gains - Implementation Costs) / Implementation Costs
1. Quantifying the Financial Gains (The Numerator):
-
Cost of Averted Downtime (The Biggest Win): This is your primary value driver.
-
Formula:
(Number of Averted Failures) x (Avg. Hours of Downtime per Failure) x (Cost per Hour of Downtime) -
Your
Cost per Hour of Downtimeshould include lost revenue, idle labor costs, and potential contractual penalties. Even a single averted failure on a critical asset can often pay for the entire system’s annual cost. -
Reduced Maintenance Costs:
-
Savings from eliminating unnecessary preventive maintenance tasks.
-
Reduction in overtime pay and rush shipping fees for emergency parts.
-
Optimized Inventory Savings:
-
Calculate the reduction in carrying costs from holding less spare parts inventory (typically 15-25% of the inventory’s value annually).
2. Quantifying the Implementation Costs (The Denominator):
-
Development & Setup: The cost of your citizen developer’s time to build and configure the AppSheet app and integrate the Gemini API. This is significantly lower than traditional software development.
-
Subscription & Usage: Your AppSheet plan costs and the pay-as-you-go costs for Gemini API calls. For most industrial use cases, these API costs are minimal compared to the value of the insights they provide.
A Hypothetical Example:
Imagine a single averted failure on your main production line saves 6 hours of downtime, which you’ve calculated costs your business $10,000 per hour. That’s a $60,000 saving from one accurate prediction. If your total cost for development time and a year’s worth of API calls is $7,500, you’ve achieved a 700% ROI from a single event.
When you present the numbers this way, the system is no longer a “cost center.” It’s a powerful and undeniable profit driver that provides a sustainable competitive advantage.
Ready to Prevent Your Next Equipment Failure
Key Takeaways and Final Thoughts
We’ve journeyed from a simple concept—avoiding equipment failure—to a tangible, AI-powered solution built on the accessible and powerful combination of AppSheet and Gemini AI. The architecture we’ve outlined represents a fundamental shift in operational strategy, moving beyond reactive fixes and scheduled check-ups into the realm of true predictive maintenance.
Let’s distill the core principles:
-
Democratized AI: The fusion of AppSheet’s no-code interface with Gemini’s advanced analytical capabilities puts the power of predictive AI directly into the hands of the teams on the ground. You no longer need a dedicated data science department to start making intelligent, data-driven predictions.
-
Actionable Intelligence, Not Just Data: The goal isn’t just to collect sensor readings or maintenance logs. It’s to transform that raw data into a clear, actionable insight—like “Pump 7B has an 85% probability of failure in the next 72 hours due to abnormal vibration patterns”—and deliver it through a user-friendly AppSheet interface.
-
A Virtuous Cycle of Improvement: The more data your team captures through the app, the more refined Gemini’s predictions become. This creates a self-improving system where your operational intelligence deepens with every maintenance cycle, continuously reducing downtime and optimizing resource allocation.
The era of running equipment until it breaks is over. By leveraging the tools already within the Google Cloud ecosystem, you can build a proactive, intelligent, and cost-effective maintenance program that not only saves money but also enhances safety and operational resilience. The barrier to entry for AI-driven excellence has never been lower; the time to build is now.
Scale Your Architecture with an Expert GDE Audit
The blueprint provided in this article is your launchpad. It’s a powerful proof-of-concept that can deliver immediate value. However, transitioning from a pilot project to an enterprise-wide, mission-critical system introduces new challenges in scalability, security, and governance. Before you scale, it’s crucial to ensure your foundation is rock-solid.
This is where an expert GDE (Google Developer Expert) audit becomes invaluable. A GDE specializing in AppSheet and Google Cloud can provide an objective, in-depth review of your architecture to de-risk your investment and accelerate your path to production.
An expert audit will typically analyze:
-
Data Model & Pipeline: Is your data schema in Google Sheets or BigQuery optimized for both AppSheet performance and efficient analysis by Gemini? Are there bottlenecks in your data ingestion process?
-
AppSheet Performance & UX: Is your app designed for optimal sync times and offline capability? Is the user experience intuitive for field technicians, ensuring high-quality data capture?
-
Gemini Integration & Prompt Engineering: Are your API calls to Gemini efficient and cost-effective? Are your prompts structured to elicit the most accurate and reliable predictions, minimizing hallucinations and maximizing relevance?
-
Security & Governance: Have you implemented robust security filters and role-based access controls? Does your solution comply with your organization’s data governance policies?
-
Scalability & Cost-Effectiveness: Can your current architecture support a 10x or 100x increase in assets, users, and data points? Are you using the most cost-effective Google Cloud services for your specific needs?
Investing in an architectural review is an investment in success. It provides the confidence and a clear roadmap to transform your innovative predictive maintenance app into a resilient, enterprise-grade solution that drives your business forward.


Stop Doing Manual Work. Scale with AI.
Want to turn these blog concepts into production-ready reality for your team?
Table Of Contents
Portfolios
Related Posts
Quick Links
Legal Stuff