

Building Agentic AppSheet Dashboards with Gemini for Automated Field Reports


The promise of real-time field data was clarity, but the reality for many managers is a digital deluge. Here’s why the very tools meant to empower your team are now creating operational friction.

The Modern Challenge for Field Ops Managers: Data Overload
We live in an era of unprecedented data collection. For field operations, this was supposed to be a revolution. Every site visit, safety inspection, and equipment check captured in real-time via mobile apps like AI-Powered Invoice Processor. The promise was simple: instant visibility, smarter decisions. The reality, however, is more complex. Instead of clarity, many managers are now facing a digital deluge. The stream of raw data from the field has become a firehose, and the challenge has shifted from data scarcity to information overload. The very tools designed to empower are now contributing to a new form of operational friction.
Why traditional mobile dashboards are failing
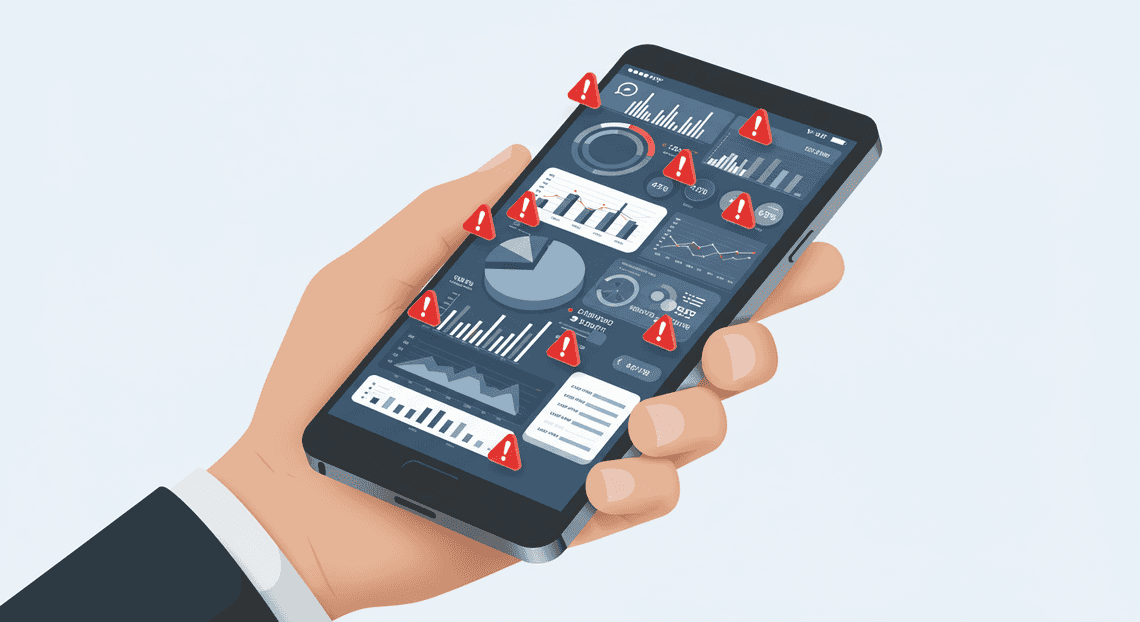
For years, the mobile dashboard has been the go-to solution for visualizing field data. It was a massive leap forward from paper forms and delayed reports. But as the volume and velocity of data have exploded, the limitations of these traditional dashboards have become glaringly obvious.
-
**They are fundamentally reactive. A traditional dashboard is a passive window into the past. It shows you KPIs, charts, and tables of what has already happened. It can tell you that 15 safety inspections failed yesterday, but it can’t tell you why or highlight the emerging pattern that connects them. The burden of analysis, correlation, and foresight falls entirely on the manager.
-
They create significant cognitive load. A screen filled with gauges, pie charts, and data tables is not an insight; it’s a puzzle. The user must mentally process all these disparate pieces of information, hunt for trends, and connect the dots between a dip in one metric and a spike in another. This manual analysis is time-consuming, mentally taxing, and difficult to do effectively on a small screen in the middle of a busy day.
-
They lack deep context. A red indicator on a dashboard is an alert, not an answer. Is a project behind schedule due to a supply chain issue, a critical equipment failure, or unexpected site conditions? To find out, the manager has to manually drill down, cross-reference different reports, read through technician notes, and scroll through photo galleries. The dashboard flags the problem but offers little help in diagnosing it.
The daily struggle of sifting through raw field data
Imagine the daily routine for a regional construction manager. Before her first meeting, she opens her operations app and is greeted by a flood of new entries: 250+ photos from various job sites, 40 completed safety checklists, dozens of daily progress logs with unstructured text notes, and a stream of equipment status updates.
Her mission is to find the critical signals hidden within this noise. Is the crack in that foundation photo a cosmetic issue or a structural red flag? Does a technician’s note about “unusual noise” from a generator correlate with a dip in its performance metrics? Which of the 15 “passed” safety inspections still contain photos that reveal potential hazards?
This is the digital equivalent of panning for gold in a river of mud. The manager is forced to become a human data processor, spending valuable hours scrolling, reading, and comparing, trying to piece together a coherent operational picture. It’s a high-stakes, inefficient process where critical details can be easily missed, leading to delayed projects, safety incidents, or costly rework.
Introducing the ‘Agentic’ Dashboard: A smarter approach
What if your dashboard could do more than just display data? What if it could understand, analyze, and communicate with you? This is the promise of an “Agentic Dashboard”—a system that transitions from being a passive data visualization tool to an active analytical partner.
Powered by generative AI models like Gemini, an agentic dashboard doesn’t just show you the numbers; it interprets them. It acts as an intelligent agent working on your behalf.
-
It Synthesizes and Summarizes: Instead of showing you 250 raw photos, it analyzes them and provides a summary: “Three sites show potential water damage in recent photos, and Site B has two images revealing un-barricaded floor openings.”
-
It Understands Natural Language: You can query your data conversationally. Ask “Which projects are at the highest risk for safety violations based on today’s reports?” and get a direct, prioritized answer, complete with links to the source data.
-
It’s Proactive: An agentic system doesn’t wait for you to spot a problem. It actively monitors the incoming data streams, identifies anomalies, correlates related information (e.g., a technician’s note, a photo, and a failed checklist item), and surfaces a complete, contextualized insight.
-
It’s Action-Oriented: The ultimate goal is to close the loop between insight and action. An agentic dashboard can suggest next steps, draft an email to a site supervisor highlighting a concern, or even pre-populate a maintenance request for a piece of equipment it identified as faulty from a photo.
This is not just a better dashboard; it’s a fundamental shift in how we interact with our operational data. It’s about offloading the cognitive burden of raw data analysis and empowering managers to focus on what they do best: making strategic decisions, coaching their teams, and solving high-level problems.
The Solution: An AI-Powered Executive Summary in AMA Patient Referral and Anesthesia Management System
Instead of building another static dashboard that merely displays raw data, we’re architecting an agentic system. The goal is to create a dashboard that doesn’t just present information but actively synthesizes it, delivering a concise, high-level briefing directly within the AppSheetway Connect Suite interface. This solution transforms the app from a simple data collection tool into an intelligent assistant for field managers, project leads, and executives.
Our Vision: From Data Points to Actionable Insights
Imagine the typical workflow for a regional manager. Throughout the day, field technicians submit dozens of individual reports: equipment status, safety checks, client feedback, materials used. The manager’s dashboard populates with rows of data, and charts might show high-level counts. But to understand the story of the day, they must manually read each report, mentally connect disparate events, identify emerging patterns, and flag critical issues. This process is time-consuming, reactive, and prone to human oversight.
Our vision fundamentally changes this paradigm. We aim to bridge the gap between raw data and strategic insight. When the manager opens their OSD App Clinical Trial Management dashboard, the first thing they see is not a table of records, but a dynamically generated executive summary.
Before:
“15 new reports submitted today.”
(Manager must now manually review all 15 reports.)
After (Our Vision):
“Executive Summary for Oct 26: Three high-priority incidents were reported in the North Sector, primarily concerning HVAC unit failures at the Acme Corp site. Technician B. Jones recommends immediate dispatch of a senior engineer. Overall team sentiment is positive, but two reports mention supply chain delays for Part #XYZ-123, suggesting a potential bottleneck.”
This is the leap from data presentation to insight generation. The dashboard evolves from a passive repository into an active advisor, performing the cognitive heavy lifting and allowing leaders to focus on decision-making, not data-mining.
The Core Components: AppSheet, Gemini, and Apps Script
This intelligent system is built upon a powerful, interconnected stack within the Google ecosystem. Each component plays a distinct and critical role.
- AppSheet: The Frontend and System of Engagement
- Role: AppSheet serves as the user interface for both data capture and consumption. Field agents use simple, robust AppSheet forms on their mobile devices to submit their daily reports. Managers and executives use a dedicated dashboard view within the same app to see the synthesized results. AppSheet is the accessible, cross-platform window into our entire operation.
- [AI Powered Cover Letter [Automated Job Creation in Real Time Jobber and Google Sheets Integration from Gmail](https://votuduc.com/Automated-Job-Creation-in-Jobber-from-Gmail-p115606) Engine](https://votuduc.com/AI-Powered-Cover-Letter-Automated Quote Generation and Delivery System for Jobber-Engine-p111092): The Orchestrator and Middleware
-
Role: Apps Script is the essential glue that connects the user-facing app to the AI brain. It acts as the server-side logic layer. An Apps Script function, running on a time-based trigger (e.g., every hour) or a webhook, will:
-
Fetch Data: Read the latest batch of raw report data directly from the underlying Google Sheet.
-
Construct the Prompt: Aggregate and format this data into a carefully engineered prompt designed for the Gemini API. This is more than just concatenating text; it involves structuring the data and providing explicit instructions on the desired tone, format, and focus of the summary.
-
Call the API: Use the
UrlFetchAppservice to make a secure API call to the Gemini model endpoint. -
Process and Store: Receive the AI-generated summary, parse the response, and write the clean text back into a specific “Summary” table or cell in the Google Sheet. AppSheet then automatically picks up this new data and displays it in the dashboard.
- Gemini: The Intelligence Engine
- Role: Gemini is the cognitive powerhouse of the architecture. As a highly capable large language model (LLM), its function is to understand context, identify patterns, and synthesize natural language. We feed it the structured and unstructured data from the field reports, and based on our prompt, it performs the complex task of reading, correlating, and summarizing—emulating the analytical process of an experienced human manager, but in a fraction of a second.
This architecture creates a seamless, automated workflow: AppSheet (UI) -> [Automated Web Scraping with [Multilingual Text-to-Speech Tool with [SocialSheet Streamline Your Social Media Posting 123](https://votuduc.com/SocialSheet-Streamline-Your-Social-Media-Posting-p737017-1)](https://votuduc.com/Multilingual-Text-to-Speech-Tool-with-Google-Workspace-p809282)](https://votuduc.com/Automated-Web-Scraping-with-Google-Sheets-p292968) (Data) -> Apps Script (Orchestration) -> Gemini (Analysis) -> Google Sheets (Insight) -> AppSheet (UI).
How This Architecture Transforms On-the-Go Decision-Making
Integrating an AI-generated summary directly into a mobile-first Building an AI Powered Business Insights Dashboard with AppSheet and Looker Studio isn’t just a technical novelty; it fundamentally changes how decisions are made in the field.
-
Accelerated OODA Loop: The classic decision-making cycle—Observe, Orient, Decide, Act—is drastically shortened. Managers can Observe the situation through the summary without sifting through noise. The AI has already helped them Orient by highlighting what’s most important. This allows them to move immediately to Decide and Act, reallocating resources or responding to a critical issue minutes after it’s reported, not hours.
-
Enhanced Situational Awareness: A manager overseeing multiple teams or a large geographical area can gain instant, holistic awareness. The summary can be prompted to compare regions, identify cross-team trends, or flag resource imbalances that would be nearly impossible to spot by looking at individual records alone.
-
Democratization of Insight: This powerful analytical capability is delivered through a simple mobile app. A supervisor on a job site, a manager in transit, or an executive traveling between offices has the same level of synthesized intelligence at their fingertips. Strategic oversight is no longer tethered to a desk or a complex BI tool.
-
Scalable Operations: As the team grows and the volume of daily reports increases from dozens to hundreds, the human capacity for manual review quickly breaks down. This AI-powered system scales effortlessly. The summary process remains just as fast and effective, ensuring that operational quality and oversight are maintained regardless of scale.
Architectural Blueprint: How to Connect the System
To bring our agentic dashboard to life, we need a robust architecture that allows our user-friendly AppSheet interface to communicate with the powerful Gemini model. Since AppSheet can’t call external APIs directly, we’ll use Genesis Engine AI Powered Content to Video Production Pipeline as an intelligent and seamless middleware. This creates a powerful, serverless trio entirely within the Google ecosystem.
Think of it this way:
-
AppSheet: The interactive frontend—our “cockpit” where users trigger actions and view results.
-
[Architecting Multi Tenant AI Workflows in Building Modular Agentic Apps Script with Gemini Function Calling](https://votuduc.com/architecting-multi-tenant-ai-workflows-in-google-apps-script-p-20260321290501): The “air traffic controller” or bridge that receives requests from AppSheet, communicates with external services, and directs data.
-
Gemini API: The AI “engine” that performs the heavy lifting of text analysis and generation.
This setup is efficient, scalable, and keeps all our components tightly integrated. Let’s break down how to build each piece of this bridge.
Step 1: Setting up your AppSheet dashboard and trigger
The journey begins in AppSheet, where the user interaction happens. Your goal here is to create a specific trigger that initiates the entire automated workflow.
First, ensure your AppSheet app’s underlying data source (a Google Sheet) has the necessary columns:
-
A column for the raw field report text (e.g.,
[ReportDetails]). -
A column to hold the AI-generated summary (e.g.,
[GeminiSummary]). -
A column to track the status (e.g.,
[AnalysisStatus]), which can be used to trigger the Automated Work Order Processing for UPS.
Next, you’ll create an [Architecting Autonomous Data Entry Apps with AppSheet and Building Self-Correcting Agentic Workflows with Vertex AI](https://votuduc.com/architecting-autonomous-data-entry-apps-with-appsheet-and-vertex-ai-p-20260322535129) to act as the starting pistol for our process.
-
Create a New Bot: In the AppSheet editor, navigate to the
Automationsection and create a new bot. -
Configure the Event: The event is the “if” part of our “if-this-then-that” logic. A reliable method is to trigger the bot when a user explicitly requests an analysis.
Create an* Action** button in your app’s UI (e.g., “Generate Summary”).
-
This action should set the
[AnalysisStatus]column for a specific row to a value like “Pending Analysis”. -
Set your bot’s event to trigger on
Data Change->Updates onlyfor the table containing your reports, with the condition[AnalysisStatus] = "Pending Analysis".
- Define the Process Step: This is the “then” part. After the event is triggered, we need to call our Apps Script.
-
Add a step to your process and choose the
Call a scripttask. -
You’ll need to link this to your Automating Technical Debt Audits in Apps Script with AI Agents project (which we’ll create in the next step).
-
Crucially, you must pass the necessary information to the script. The most important piece of data is a unique identifier for the report that needs to be analyzed. Pass the row’s key column (e.g.,
[ReportID]) as a parameter to the script function. This tells the script exactly which row in the Google Sheet to work on.
With this setup, a simple button press in the AppSheet app now fires a signal, carrying the specific ReportID, directly to our Apps Script bridge.
Step 2: Creating the Apps Script bridge to Gemini
Google Apps Script is the linchpin of this architecture. It will live inside the Google Sheet that backs your AppSheet app. This script will receive the call from AppSheet, prepare and send the data to Gemini, and then post the result back into the sheet.
-
Create the Script: Open your backing Google Sheet and go to
Extensions>Apps Script. This will open the script editor. -
Write the Main Function: Create a function that AppSheet will call. The function name must match what you specified in the Automating Field Inspection Corrections with AppSheet and Gemini AI step. It should accept the parameters you passed, like the report ID.
// A conceptual function structure

function processReportWithGemini(reportId) {

// Function logic will go here

}
-
Fetch Report Data: Inside this function, the first step is to use the
reportIdto find the correct row and get the full report text. You’ll use theSpreadsheetAppservice to get the active sheet, find the row corresponding to thereportId, and read the value from the[ReportDetails]column. -
Call the Gemini API: This is the core of the script.
-
Authentication: You’ll need an API key for the Gemini API. Store this securely using Apps Script’s
PropertiesService. -
Construct the Prompt: This is where you engineer your request. Create a detailed prompt that tells Gemini exactly what you want. For example: “As an expert field operations analyst, review the following field report. Provide a concise 3-bullet point summary of the main issues, identify any potential safety concerns, and give an overall sentiment score (Positive, Neutral, or Negative). Report Text: [Insert the report text fetched from the sheet here]”.
-
Make the API Call: Use the
UrlFetchAppservice to send aPOSTrequest to the Gemini API endpoint. The payload of your request will be a JSON object containing your carefully constructed prompt.
- Process the Response and Update the Sheet:
-
The Gemini API will return a JSON response. Parse this response to extract the generated text.
-
Using the
SpreadsheetAppservice again, find the same row using thereportId. -
Write the extracted summary from Gemini into the
[GeminiSummary]column for that row. You can also update the[AnalysisStatus]column to “Complete” to prevent the automation from running again on the same report.
This script now acts as a fully functional, serverless backend for your AppSheet application.
Step 3: The data flow from AppSheet to Gemini and back
Let’s trace the entire journey of a single request to solidify our understanding of the architecture. This sequence of events happens in seconds, creating a seamless experience for the end-user.
-
User Action (AppSheet): A manager in the field views a newly submitted report in the AppSheet dashboard and clicks the “Generate Summary” action button.
-
Trigger (AppSheet): The action sets the
[AnalysisStatus]column for that report’s row to “Pending Analysis”. The AppSheet Automation bot detects this specific data change and its event is triggered. -
Webhook Call (AppSheet → Apps Script): The bot’s process executes the
Call a scripttask, invoking theprocessReportWithGeminifunction in our Apps Script and passing the unique[ReportID]as an argument. -
Data Fetch (Apps Script): The Apps Script function receives the
ReportID. It accesses the connected Google Sheet and reads the full text from the[ReportDetails]column for that specific ID. -
API Request (Apps Script → Gemini): The script embeds the report text into a pre-defined prompt template, constructs a JSON payload, and sends it to the Gemini API endpoint using
UrlFetchApp. -
AI Processing (Gemini): Gemini’s large language model processes the incoming request, analyzes the report text according to the prompt’s instructions, and generates the summary, safety analysis, and sentiment score.
-
API Response (Gemini → Apps Script): The Gemini API sends the generated text back to the Apps Script function as a JSON object.
-
Data Write (Apps Script → Google Sheets): The script parses the JSON to get the clean text. It then accesses the Google Sheet one last time to write the AI-generated content into the
[GeminiSummary]column and updates the[AnalysisStatus]to “Complete”. -
UI Sync (Google Sheets → AppSheet): AppSheet’s backend detects the data change in the Google Sheet. It automatically syncs this change to the user’s device.
-
Result Displayed (AppSheet): The
[GeminiSummary]field in the user’s dashboard populates with the new analysis, completing the round trip. The manager can now see the AI-powered insights directly within their operational dashboard.
Implementation Deep Dive: Crafting the AI Summary
This is where the agentic magic happens. We’re going to take the raw, disconnected stream of data from our field technicians and use Gemini to weave it into a coherent, insightful narrative. The process breaks down into three critical steps: preparing the data, writing a powerful prompt, and displaying the result.
Structuring your field data for effective AI synthesis
The first rule of working with AI is “Garbage In, Garbage Out.” Gemini can perform incredible feats of synthesis, but it needs clean, structured data to do its best work. If your data is a mess, your summary will be too.
Our goal is to collect all relevant field reports for a given day and project and format them into a single block of text that the AI can easily understand. Let’s assume you have a Field_Reports table in AppSheet with a structure similar to this:
| Column Name | Column Type | Notes |
| :--- | :--- | :--- |
| ReportID | Text | Unique identifier for each report. |
| ProjectID | Ref | Links to your Projects table. |
| Timestamp | DateTime | When the report was submitted. |
| Technician | Text | Name of the person submitting the report. |
| Status | Enum | Critical for context. Use values like In Progress, Completed, Blocked, Awaiting Materials. |
| Notes | LongText | The detailed description of the work performed or the issue encountered. |
| Photo | Image | Visual context (though we’ll focus on text for the summary). |
The key is consistency. Using an Enum for the Status field is far more effective than letting technicians type free-form text, as it gives the AI clear, unambiguous signals.
To prepare this data for Gemini, we need to create an AppSheet Automation that triggers daily (e.g., at 5 PM). This automation will find all of today’s reports for a specific project and concatenate them into a single text string.
You can achieve this with an expression that looks something like this inside your automation’s “Call a webhook” or “Call a script” task:
<<CONCATENATE(

SELECT(

Field_Reports[Formatted_Report],

AND(

[ProjectID] = [_THISROW].[ProjectID],

DATE([Timestamp]) = TODAY()

)

)

)>>
This expression assumes you have a virtual column named Formatted_Report in your Field_Reports table that structures each entry. The formula for this virtual column would be:
CONCATENATE(

"---", "\n",

"Timestamp: ", TEXT([Timestamp], "MM/DD/YYYY HH:MM"), "\n",

"Technician: ", [Technician], "\n",

"Status: ", [Status], "\n",

"Notes: ", [Notes], "\n"

)
When the automation runs, it will generate a clean, machine-readable block of text like this, ready to be inserted into our prompt:
Timestamp: 10/27/2023 09:15

Technician: Alice

Status: In Progress

Notes: Started trenching for the main conduit. Soil is rockier than expected, slowing progress.

Timestamp: 10/27/2023 11:30

Technician: Bob

Status: Completed

Notes: Installed junction box JB-03 and pulled feeder cables. All connections torqued to spec.

Timestamp: 10/27/2023 14:45

Technician: Alice

Status: Blocked

Notes: Hit a suspected utility line while trenching. Paused work pending survey from the utility company. Site is secured.
This structured input is the foundation for a high-quality AI-generated summary.
Writing the perfect Gemini prompt for daily progress reports
A well-crafted prompt is the difference between a generic, unhelpful summary and a sharp, actionable intelligence brief. We need to guide Gemini by giving it a role, clear context, a specific task, and a strict output format.
Here is a robust prompt template designed for this exact purpose. You would include this in the body of your API call to the Gemini model.
You are an expert construction project manager responsible for creating daily executive summaries. Your analysis is sharp, concise, and focused on actionable insights.

**CONTEXT:**

I will provide you with a list of raw, timestamped field reports from various technicians for a single project on a specific day. These reports document tasks performed, progress made, and any issues encountered.

**TASK:**

Synthesize the provided reports into a single, well-structured daily progress summary. The summary should highlight key events, identify any issues, and provide a clear picture of the project's status for stakeholders who do not have time to read every individual report.

**OUTPUT FORMAT (Strictly use Markdown):**

### Daily Summary: [Insert Today's Date]

**Overall Status:**

* A brief, one-to-two sentence overview of the day's progress and the current project mood (e.g., On Track, Minor Delays, Critical Block).

**Key Accomplishments:**

* A bulleted list of significant tasks completed or milestones reached. Extract these from reports marked as "Completed".

**Blockers & Challenges:**

* A bulleted list of any issues, blockers, or potential risks identified in the reports. Pay close attention to reports marked as "Blocked". If no blockers are mentioned, state "None reported."

**Team Activity:**

* A brief summary of which technicians were active and what they generally worked on.

**RAW FIELD REPORTS FOR YOUR ANALYSIS:**

[<<INSERT_CONCATENATED_FIELD_DATA_FROM_APPSHEET_HERE>>]
Why this prompt works:
-
Role-Playing: “You are an expert construction project manager…” immediately sets the tone and domain expertise.
-
Clear Context & Task: It explicitly states what data it will receive and what it needs to do with it.
-
Strict Formatting: Requesting Markdown with specific headings (
###,**,*) is crucial. This isn’t just for aesthetics; it makes the response programmatically predictable and easy to render beautifully in AppSheet. -
**Action-Oriented Instructions: It guides the AI on how to analyze the data (e.g., “Extract these from reports marked as ‘Completed’”).
-
Data Placeholder: The
[<<...>>]section clearly marks where our concatenated data from the previous step will be injected by the AppSheet automation.
Parsing the AI response and displaying it in an AppSheet View
Once Gemini processes our prompt, it sends back a response, typically in JSON format. The generated Markdown text is usually nested within a path like candidates[0].content.parts[0].text. Your automation (whether it’s an Apps Script or another webhook service) needs to parse this JSON to extract the text content.
1. Store the Summary
First, create a new table in your app called Daily_Summaries with at least these columns:
| Column Name | Column Type |
| :--- | :--- |
| SummaryID | Text (Set as Key) |
| ProjectID | Ref |
| Date | Date |
| SummaryText | LongText |
Your AppSheet automation, after receiving the response from Gemini, will perform an “Add a new row” action to this Daily_Summaries table, placing the extracted Markdown into the SummaryText column.
2. Create the View
Now, let’s display this summary in a user-friendly way.
-
Create a new Detail View in AppSheet based on the
Daily_Summariestable. -
Select the columns you want to display, primarily the
SummaryTextcolumn. -
Here is the most important step: In the column properties for
SummaryText(in the UX -> Views -> [Your Detail View] -> Column Order section), find the setting for Text formatting and enable “Contains long-form text with markdown”.
This single checkbox transforms the raw text output from Gemini…
Before (Raw Text):
### Daily Summary: 10/27/2023

**Overall Status:**

* Progress was made on electrical installation, but a critical blocker was encountered in trenching, causing a minor delay to the groundwork schedule.

**Key Accomplishments:**

* Junction box JB-03 was successfully installed and feeder cables were pulled.

**Blockers & Challenges:**

* A suspected utility line was discovered during trenching. All related work is paused pending a utility survey.

**Team Activity:**

* Alice worked on trenching before being blocked. Bob completed electrical installation tasks.
After (Rendered in AppSheet):
Daily Summary: 10/27/2023
Overall Status:
- Progress was made on electrical installation, but a critical blocker was encountered in trenching, causing a minor delay to the groundwork schedule.
Key Accomplishments:
- Junction box JB-03 was successfully installed and feeder cables were pulled.
Blockers & Challenges:
- A suspected utility line was discovered during trenching. All related work is paused pending a utility survey.
Team Activity:
- Alice worked on trenching before being blocked. Bob completed electrical installation tasks.
You can now link to these summaries from your main project dashboard, giving stakeholders a one-click view of the AI-generated daily brief. This closes the loop, turning raw field data into an automated, intelligent, and perfectly formatted report right inside your AppSheet application.
The Business Impact Beyond the Technology
While the fusion of AppSheet and Gemini is a technical marvel, its true value isn’t found in the code or the configuration screens. The real revolution lies in how it fundamentally reshapes workflows, enhances decision-making, and unlocks new levels of operational efficiency. Moving from a passive data repository to an active, agentic dashboard creates a ripple effect of positive business outcomes that extend far beyond the IT department.
Reducing cognitive load for managers
In any field operation, managers are the critical nexus for information flow. They are also a bottleneck. They are constantly inundated with raw data—a deluge of daily reports, photos, checklists, and unstructured text notes. The process of manually sifting through this information to find the “signal in the noise” is not just time-consuming; it’s mentally exhausting. This constant cognitive load leads to decision fatigue, where the quality of decisions degrades over time, and critical issues can be easily missed.
An agentic dashboard directly attacks this problem. Instead of presenting a firehose of raw reports, the Gemini-powered system pre-processes and synthesizes the information. It acts as a tireless junior analyst, performing the initial triage that consumes so much of a manager’s day.
-
Before: A manager scrolls through 50 individual site safety reports, mentally trying to connect dots and spot trends.
-
After: The dashboard presents a single, high-priority card: “Pattern Detected: 4 of 15 reports from the Western region mention ‘inadequate fall protection gear.’ This represents a 30% increase over last month. Synthesized summary and list of affected sites are attached.”
The manager’s role is elevated from data archaeologist to strategic decision-maker. Their mental energy is preserved for what humans do best: nuanced judgment, communication, and decisive action.
Accelerating response times with clear summaries
The gap between an event happening in the field and a response being initiated is a critical—and costly—metric. This “time-to-action” latency is often caused by communication delays and the need for manual summarization. A field technician submits a critical failure report, but it sits in an inbox, waiting for the manager to read it, understand its implications, and formulate a response.
By integrating Gemini, the dashboard becomes a real-time intelligence hub. As data flows in from AppSheet, the AI instantly parses, categorizes, and summarizes it into a clear, actionable format. It extracts key entities (like equipment serial numbers, locations, and error codes) and understands the urgency from the technician’s natural language description.
This means a critical report is no longer just another line item in a list. It’s an immediate, structured alert. The system can generate an instant summary like, “CRITICAL ALERT: Generator G-77B at Northwind Substation has failed. Report indicates ‘catastrophic turbine seizure.’ Production is offline. Recommending immediate dispatch of Level 3 engineering team.” This summary can trigger notifications, create a draft work order, and be surfaced to the top of the dashboard in seconds, not hours. This dramatic reduction in latency minimizes downtime, mitigates safety risks, and allows the organization to operate with a new level of agility.
Scaling operational intelligence across your teams
Expertise is often a company’s most valuable and least scalable asset. A senior operations manager with 20 years of experience can glance at a set of reports and intuitively spot a developing issue that a junior manager would completely overlook. This knowledge is siloed, difficult to transfer, and creates inconsistencies in performance across different regions or teams.
An agentic dashboard serves as a mechanism to codify and scale that institutional knowledge. You can embed the “mind” of your best expert into the system’s prompts and instructions. The AI is trained to look for the specific, subtle patterns your top performers have learned to identify over decades.
This democratizes expertise. A newly promoted manager in a remote office now has a powerful co-pilot, flagging potential issues with the same level of insight as a seasoned veteran at headquarters. The dashboard can identify cross-regional trends that no single human would have the visibility to see, such as a specific component failing prematurely across multiple continents. This ensures a consistently high standard of operational awareness across the entire organization, allowing you to scale your business without diluting the quality of your oversight or decision-making.
Conclusion: Your Next Step to Smarter Field Operations
We’ve journeyed from the foundational concepts of Secure Agentic Workflows with a Firebase Auth Approval Gate to a tangible, powerful implementation within an AppSheet dashboard. The proof is clear: the barrier between complex operational needs and elegant, automated solutions is dissolving. By leveraging the reasoning capabilities of Gemini, we’ve built more than just a data visualization tool; we’ve created an intelligent partner for your field teams.
Recap: The power of an agentic AI-driven dashboard
Throughout this guide, we demonstrated a fundamental shift in how applications can serve your business. We moved beyond dashboards that merely report on what has happened to a system that actively participates in the workflow.
By integrating Gemini’s agentic capabilities directly into an AppSheet dashboard, we transformed a passive data portal into an active operational co-pilot. This architecture doesn’t just display data; it:
-
Interprets Intent: Understands complex, natural language requests from field managers.
-
Executes Multi-Step Tasks: Autonomously gathers data, analyzes inputs, synthesizes information, and generates comprehensive field reports.
-
Reduces Cognitive Load: Eliminates the need for users to manually navigate multiple screens, filter data, and copy-paste information, drastically reducing errors and saving valuable time.
-
Empowers Field Teams: Puts the power of a data analyst and a report writer directly into the hands of the people on the ground, enabling faster, more informed decision-making.
This is the core value proposition of an agentic system: it reduces friction between human intent and system action, turning your operational dashboard into a true command center.
The future of generative AI in operational management
The automated field report generator we built is just the beginning. The architectural pattern—using a powerful LLM like Gemini as a reasoning engine for a user-friendly front-end like AppSheet—is a blueprint for the future of operational management software.
The horizon is expanding rapidly. Imagine a future where your dashboard can:
-
Proactively Schedule Maintenance: Analyze incoming field reports for patterns of equipment wear and autonomously schedule a technician before a failure occurs.
-
Dynamically Allocate Resources: Interpret real-time project updates and automatically re-assign personnel and equipment to the highest-priority tasks.
-
Generate On-the-Fly Safety Briefings: Synthesize site-specific hazard data, weather conditions, and task requirements into a custom safety protocol delivered to a technician’s device just before they begin work.
-
Optimize Logistics in Real Time: Monitor supply levels, traffic patterns, and job site progress to dynamically re-route deliveries and minimize downtime.
This isn’t science fiction. This is the logical evolution of business process automation, powered by generative AI that can reason, plan, and act within the guardrails you define.
Ready to scale your architecture? Book a discovery call
The journey from a proof-of-concept to a production-ready, secure, and scalable solution requires careful architectural planning and deep domain expertise. While this article provides the blueprint, implementing it across your entire organization involves navigating data governance, optimizing API costs, refining prompts for enterprise-grade reliability, and ensuring robust error handling.
You don’t have to build it alone.
Our team specializes in designing and deploying bespoke AI-driven solutions on the Google Cloud and AppSheet platforms. We help businesses like yours bridge the gap between operational challenges and cutting-edge technology.
**If you’re ready to transform your field operations with an intelligent, agentic dashboard, let’s talk. Book a complimentary discovery call with our experts today to discuss your specific use case and build a roadmap for your success.**Your journey towards a smarter, more responsive, and automated operational future begins now.


Stop Doing Manual Work. Scale with AI.
Want to turn these blog concepts into production-ready reality for your team?
Table Of Contents
Portfolios
Related Posts
Quick Links
Legal Stuff