

Build an IoT Predictive Maintenance App with AppSheet and Google Sheets


For many operations, the default maintenance strategy is also the most expensive one. Discover the staggering hidden costs of “run-to-failure” and why waiting for equipment to break is a multi-million dollar gamble.
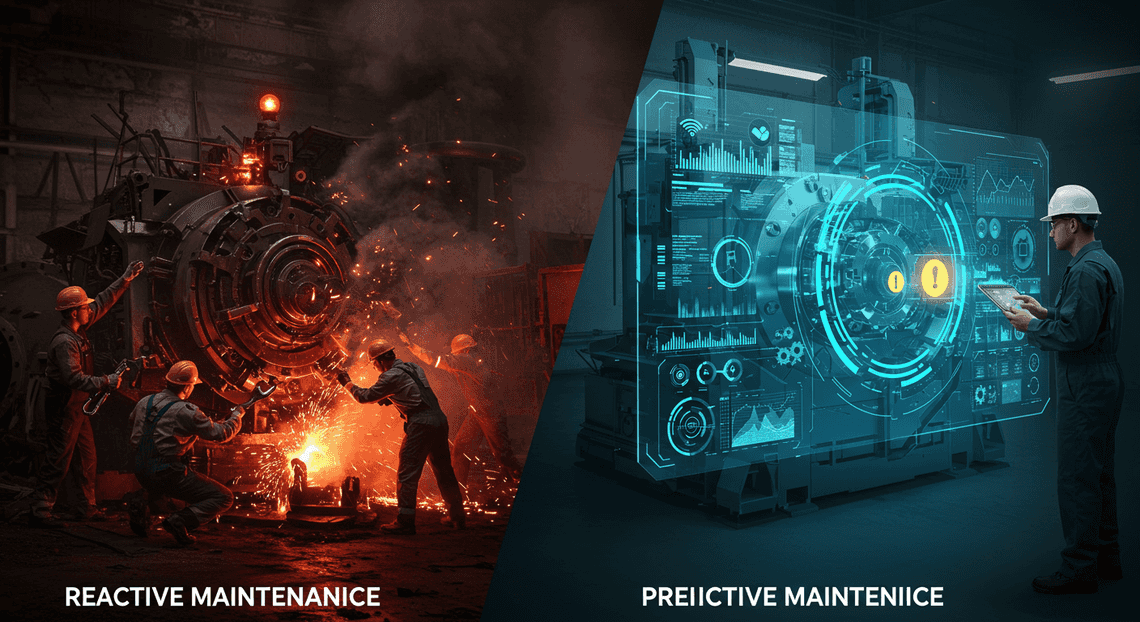
The Problem: The High Cost of Reactive Maintenance
Before we dive into building our solution, let’s ground ourselves in the problem we’re trying to solve. In any operation that relies on physical equipment—from a factory floor to an HVAC company—the approach to maintenance is a critical, multi-million dollar decision. For too long, the default strategy has been the most disruptive and expensive one.
Why ‘run-to-failure’ is a losing strategy for industrial operations
The “run-to-failure” model, also known as reactive maintenance, is exactly what it sounds like: you wait for a machine to break, and then you fix it. On the surface, it seems simple. No complex planning, no “unnecessary” check-ups. You just react. But this simplicity is a mirage that conceals staggering hidden costs.
Running to failure isn’t a strategy; it’s a gamble where the house always wins. Here’s why it’s so damaging:
-
Unplanned Downtime: This is the most obvious and painful cost. When a critical machine stops unexpectedly, production halts. Orders are delayed, service level agreements (SLAs) are breached, and revenue is lost for every minute the line is down.
-
Cascading Failures: Equipment is a complex system of interconnected parts. The failure of a single inexpensive bearing can lead to the catastrophic destruction of a motor, a gearbox, or other critical components. A $50 problem quickly becomes a $5,000 emergency.

-
Inflated Repair Costs: Emergency repairs are a budget-killer. You’re paying for expedited shipping on parts, overtime for technicians, and premium rates for outside contractors. Planned maintenance is always cheaper than a frantic, middle-of-the-night fix.
-
Safety Hazards: A machine that fails unexpectedly is an uncontrolled event. This can create significant safety risks for operators and technicians, from electrical faults to mechanical breakages.
-
Inventory Inefficiency: The reactive model forces you into a difficult choice: either tie up huge amounts of capital by stocking every conceivable spare part “just in case,” or face long lead times and extended downtime when a non-stocked part fails.
Essentially, the run-to-failure model cedes control of your operations to chance. It’s a constant state of firefighting that drains resources, kills efficiency, and puts the entire business at risk.
Introducing the proactive model: Predictive Maintenance (PdM)
If reactive maintenance is about waiting for a problem, predictive maintenance (PdM) is about anticipating it. It represents a fundamental shift from “fail and fix” to “sense and respond.”
The core idea of PdM is to use real-time data from equipment to predict when a failure is likely to occur. Instead of servicing a machine on a fixed schedule (preventive maintenance) or after it breaks (reactive maintenance), you perform maintenance at the optimal moment: right before a problem arises.
This is achieved by:
-
Monitoring: Placing sensors on equipment to continuously collect key operational data, such as vibration, temperature, current draw, or pressure.
-
Analyzing: Processing this data to identify patterns, anomalies, and trends that are known precursors to failure. A gradual increase in a motor’s vibration, for example, is a classic indicator of bearing wear.
-
**Predicting & Acting: When the data crosses a predefined threshold or a predictive model flags an issue, an alert is automatically triggered, allowing a work order to be created and maintenance to be scheduled before the catastrophic failure occurs.
The benefits are the direct inverse of the reactive model’s pitfalls: maximized uptime, reduced repair costs, improved safety, optimized inventory, and a longer lifespan for your critical assets.
Solution Overview: A lean IoT to AI-Powered Invoice Processor workflow using the Google ecosystem
Traditional PdM systems can be prohibitively expensive and complex, requiring massive investment in proprietary software, data scientists, and infrastructure. But they don’t have to be. We can build a powerful, lean, and highly effective PdM system by leveraging the accessible and interconnected tools within the Google ecosystem.
Our approach democratizes predictive maintenance, making it achievable for operations of any size. Here’s the high-level data flow we’ll be building:
IoT Sensor (e.g., ESP32) -> [Automated Web Scraping with [Multilingual Text-to-Speech Tool with [SocialSheet Streamline Your Social Media Posting 123](https://votuduc.com/SocialSheet-Streamline-Your-Social-Media-Posting-p737017-1)](https://votuduc.com/Multilingual-Text-to-Speech-Tool-with-Google-Workspace-p809282)](https://votuduc.com/Automated-Web-Scraping-with-Google-Sheets-p292968) (as a Database) -> [AMA Patient Referral and Anesthesia Management System](https://votuduc.com/AMA-Patient-Referral-and-Anesthesia-Management-System-p428972) (as the User App)
-
Data Collection (The “IoT” part): A low-cost microcontroller like an ESP32, equipped with a simple sensor (e.g., a vibration or temperature sensor), will be attached to our target equipment. This device will periodically wake up, take a reading, and send the data over the internet.
-
Data Aggregation & Analysis (Google Sheets): The sensor data won’t be sent to a complex database. Instead, it will be posted directly into a Google Sheet. This sheet acts as our simple, effective, and surprisingly powerful database. We can use built-in formulas or [AI Powered Cover Letter [Automated Job Creation in Real Time Jobber and Google Sheets Integration from Gmail](https://votuduc.com/Automated-Job-Creation-in-Jobber-from-Gmail-p115606) Engine](https://votuduc.com/AI-Powered-Cover-Letter-Automated Quote Generation and Delivery System for Jobber-Engine-p111092) to perform basic analysis—for instance, flagging any reading that exceeds a safe operational threshold.
-
Action & Interface (AppSheetway Connect Suite): This is where the data becomes actionable. We will connect OSD App Clinical Trial Management to our Google Sheet. With zero code, AppSheet will transform our spreadsheet into a fully functional web and mobile application. This app will allow technicians to:
-
View a real-time dashboard of equipment status.
-
Receive push notifications when a machine’s sensor data enters a “warning” or “critical” state.
-
Create, assign, and track maintenance work orders.
-
Log repair notes and update the equipment’s status directly from the field.
This workflow is the epitome of a lean solution. It’s fast to develop, infinitely customizable, and built on tools you likely already use, turning the powerful concept of predictive maintenance from an expensive enterprise dream into a practical weekend project.
Architecting the Solution: The Four Key Components
Before we start building, let’s step back and look at the blueprint. A robust application, even a no-code one, is built from distinct, well-defined components that work in concert. Our predictive maintenance solution is no different. We’ve chosen a stack that is accessible, powerful, and integrates beautifully, creating a seamless flow of data from the physical machine to the technician’s screen.
The architecture can be visualized as a simple data pipeline:
[Physical Machine & Sensors] -> [IoT Gateway] -> [[Genesis Engine AI Powered Content to Video Production Pipeline](https://votuduc.com/Genesis-Engine-AI-Powered-Content-to-Video-Production-Pipeline-p452744)] -> [Google Sheets] <-> [AppSheet App]
Each stage in this pipeline is handled by one of our four key components. Let’s break them down.
Component 1: IoT Sensors and Gateway as the Data Source
This is the origin of our data, the point where the physical world is translated into digital information.
-
IoT Sensors: These are the nerve endings of our system, attached directly to the equipment we want to monitor. For predictive maintenance, common sensors include vibration sensors to detect mechanical stress, temperature sensors to monitor for overheating, acoustic sensors to listen for unusual noises, and pressure sensors for hydraulic or pneumatic systems. The specific sensors you use will depend entirely on the failure modes of your machinery.
-
The Gateway: A sensor rarely talks directly to the cloud. It typically sends its data to a local IoT gateway. The gateway’s job is to aggregate data from one or more sensors, perform any necessary local processing (like converting analog signals to digital), and then securely transmit the packaged data over the internet (often via Wi-Fi, cellular, or Ethernet).
In our architecture, the gateway is the crucial link to the cloud. We will configure it to send its data payload—containing a device ID, timestamp, and sensor readings—as an HTTP POST request to a specific web endpoint. This is the handoff point to our next component.
Component 2: Google Sheets as the Persistent Data Store
You might be surprised to see a spreadsheet acting as the database for an IoT application, but for this use case, it’s a brilliant choice. Google Sheets is not just a data table; it’s our accessible, transparent, and highly-connective data store.
Here’s why it works so well:
-
Simplicity and Transparency: The data is always visible in a familiar row-and-column format. This is invaluable for debugging, manual data entry, and giving non-technical stakeholders a direct view of the raw information.
-
Native AppSheet Integration: AppSheet is built to use Google Sheets as a first-class data source. The connection is seamless, instant, and requires zero configuration of drivers or connection strings.
-
Cost-Effectiveness: It’s free and readily available to anyone with a Google account.
-
Sufficient Scale: While it’s not a high-throughput transactional database, a single Google Sheet can hold millions of cells. For many predictive maintenance scenarios where you might log data every few minutes or hours, this is more than enough capacity to store years of historical data for analysis.
We will set up a simple sheet with columns like Timestamp, DeviceID, Vibration, Temperature, and Status to act as the central repository for all incoming sensor data.
Component 3: [Architecting Multi Tenant AI Workflows in Building Modular Agentic Apps Script with Gemini Function Calling](https://votuduc.com/architecting-multi-tenant-ai-workflows-in-google-apps-script-p-20260321290501) as the Middleware Bridge
This is the unsung hero of our architecture—the intelligent glue that connects the industrial world of the IoT gateway to the user-friendly world of Google Sheets. Automating Technical Debt Audits in Apps Script with AI Agents is a serverless JavaScript platform that runs inside your Google account.
Its role is to act as a secure and programmable middleware layer:
-
Create a Web Endpoint: Using Apps Script’s
doPost(e)function, we can instantly deploy a script as a web app. This generates a unique, secure URL. This URL is the endpoint that our IoT gateway will send its HTTP POST requests to. -
Parse and Process Data: The gateway will send data in a specific format, likely JSON. The Apps Script code will receive this request, parse the JSON payload to extract the individual data points (like
deviceIDandtemperature), and perform any necessary transformations or validations. -
Securely Write to Sheets: Instead of exposing our Google Sheet directly to the public internet (a major security risk), our script acts as a gatekeeper. Once the data is validated, the script uses the
SpreadsheetAppservice to securely append the data as a new row in our target sheet.
In short, Apps Script is our lightweight, serverless API backend that requires zero server management and lives right alongside our data.
Component 4: AppSheet as the No-Code User Interface and Action Layer
This is where the data comes to life. AppSheet sits on top of our Google Sheet and transforms that raw data into a rich, interactive, and actionable application for web and mobile devices. This is the interface our maintenance team will actually use.
AppSheet serves several critical functions:
-
Data Visualization: It automatically generates views of our data. We can create dashboards with charts and graphs to visualize sensor readings over time, helping technicians spot anomalies and trends that might indicate an impending failure.
-
User-Friendly Interface: It presents the data in a clean, organized way. A technician can easily filter to see the history of a specific machine, view its current status, and see any active alerts.
-
**The Action Layer: This is the most important part. AppSheet isn’t just for viewing data; it’s for acting on it. We can build features directly into the app, such as:
-
A button to create a “Maintenance Work Order” when a machine is flagged for inspection.
-
A form for technicians to log their maintenance notes, which writes back to a separate sheet.
-
The ability to change a machine’s status from “Healthy” to “Under Maintenance.”
-
Automations and Notifications: We can configure rules within AppSheet to automatically trigger actions. For example, if a temperature reading in the sheet exceeds a predefined threshold, AppSheet can automatically send a push notification or an email directly to the on-duty technician, ensuring a rapid response.
Step-by-Step Implementation Guide
With our architecture mapped out, it’s time to roll up our sleeves and build. This section provides a detailed walkthrough, from structuring the data sink in Google Sheets to configuring the intelligent front-end in AppSheet. Follow these steps carefully to create a robust data pipeline and a powerful user application.
Step 1: Structuring Your Google Sheet to Capture Telemetry Data
Before we can receive data, we need a place to store it. The structure of your Google Sheet is the foundation of the entire application. A well-organized sheet ensures that both our Apps Script and AppSheet can interpret and manage the data correctly.
First, create a new Google Sheet. Let’s name it IoT_Predictive_Maintenance_Data. Inside this sheet, rename the first tab to Telemetry.
Now, define the headers in the first row. These headers are the schema for our IoT data. For a typical predictive maintenance scenario involving rotating machinery, the following columns are a great starting point:
| Header Name | Data Type | Description |
| :--- | :--- | :--- |
| Timestamp | DateTime | The exact date and time the data point was recorded. Essential for time-series analysis. |
| RecordID | Text | A unique identifier for each row. We’ll generate this with an AppSheet formula later. |
| DeviceID | Text | The unique identifier for the IoT device or machine (e.g., “PUMP-001”, “CNC-A4”). |
| Temperature | Number | The operating temperature of the machine in Celsius or Fahrenheit. |
| Vibration | Number | Vibration level, often measured in mm/s or G-force. A key indicator of mechanical wear. |
| OperatingHours | Number | The cumulative hours the machine has been running. |
| StatusCode | Text | A code representing the machine’s current state (e.g., “RUNNING”, “IDLE”, “FAULT”). |
| AlertTriggered | Yes/No | A boolean (TRUE/FALSE) flag that our AppSheet Automated Work Order Processing for UPS will set if a predictive threshold is crossed. |
| MaintenanceNotes | LongText | A field for technicians to add notes after performing maintenance. |
Key Best Practices:
-
Use Clear Headers: The names should be descriptive and contain no spaces or special characters.
-
Freeze the Header Row: Go to
View > Freeze > 1 row. This keeps your headers visible as data pours in. -
No Merged Cells: AppSheet and Apps Script work best with simple, tabular data. Avoid merged cells at all costs.
Your blank sheet should now look clean and ready to receive data, forming the perfect backbone for our application.
Step 2: Writing the Apps Script to Listen for IoT Data
This is where we build the bridge. Google Apps Script will act as a simple, serverless web service that listens for incoming HTTP POST requests from our IoT devices and writes the data into our Google Sheet.
-
From your
IoT_Predictive_Maintenance_DataGoogle Sheet, navigate toExtensions > Apps Script. This will open a new browser tab with the script editor. -
Delete any boilerplate code in the
Code.gsfile. -
Paste the following script. We’ll break down what it does below.
// Define a global constant for the sheet name to avoid magic strings.

const SHEET_NAME = "Telemetry";

/**

* Handles HTTP POST requests. This is the primary function that acts as our API endpoint.

* IoT devices will send their JSON data payloads to this function's deployed URL.

* @param {Object} e - The event parameter containing the request data.

*/

function doPost(e) {

let response;

try {

// Lock the script to prevent concurrent access issues, ensuring data integrity.

const lock = LockService.getScriptLock();

lock.waitLock(30000); // Wait up to 30 seconds for other executions to finish.

// Open the Google Sheet and select the target tab.

const doc = SpreadsheetApp.getActiveSpreadsheet();

const sheet = doc.getSheetByName(SHEET_NAME);

// Parse the JSON payload from the POST request.

// The IoT device must send data with a 'Content-Type' of 'application/json'.

const data = JSON.parse(e.postData.contents);

// Get the current date and time for the timestamp.

const timestamp = new Date();

// Append the data to a new row in the sheet.

// The order here MUST match the column order in your Google Sheet.

sheet.appendRow([

timestamp,

null, // Placeholder for RecordID, which AppSheet will generate.

data.deviceID,

data.temperature,

data.vibration,

data.operatingHours,

data.statusCode,

false, // Default value for AlertTriggered.

null // Placeholder for MaintenanceNotes.

]);

// Prepare a success response to send back to the IoT device.

response = {

status: "success",

message: "Data logged successfully."

};

// Release the lock.

lock.releaseLock();

} catch (error) {

// If any error occurs, log it for debugging and prepare an error response.

console.error("Error logging data: " + error.toString());

response = {

status: "error",

message: "Failed to log data.",

error: error.toString()

};

}

// Return a JSON response to the client (the IoT device).

// This is crucial for the device to confirm that the data was received.

return ContentService

.createTextOutput(JSON.stringify(response))

.setMimeType(ContentService.MimeType.JSON);

}
Code Breakdown:
-
doPost(e): This is a special function name in Apps Script. It automatically runs whenever aPOSTrequest is made to the script’s URL. Theeparameter contains all the request data. -
LockService: This is a critical feature for preventing race conditions. If two devices send data at the exact same moment, the lock ensures one process finishes writing to the sheet before the next one starts, preventing data corruption. -
JSON.parse(e.postData.contents): This line takes the raw text from the POST request and converts it into a JavaScript object, assuming the IoT device sent it in JSON format. -
sheet.appendRow([...]): This is the core action. It adds a new row to the bottom of ourTelemetrysheet. Notice the order of elements in the array directly corresponds to our sheet’s columns. -
ContentService: This service is used to formulate and send a proper HTTP response back to the device that sent the data.
Step 3: Deploying the Script as a Web App to Create a Data Gateway
A script sitting in the editor is just code. To turn it into a live endpoint that can receive data from the internet, we must deploy it as a Web App.
-
Save the Script: In the Apps Script editor, click the floppy disk icon to save your project. Give it a name like “IoT Data Listener”.
-
Deploy: Click the blue Deploy button in the top-right corner and select New deployment.
-
Configure Deployment:
Click the gear icon next to “Select type” and choose* Web app**.
-
Description: Enter a brief description, e.g., “IoT Predictive Maintenance Data Gateway v1”.
-
Execute as: Select Me ([email protected]). This means the script runs with your permissions.
-
Who has access: Select Anyone. This is crucial. It makes the endpoint public, but unguessable. Your IoT device is an anonymous user on the internet, so it needs this permission level.
- Authorize and Deploy:
Click* Deploy**.
Google will prompt you to authorize the script’s permissions. Click* Authorize access**.
Choose your Google account. You may see a “Google hasn’t verified this app” warning. This is normal for your own scripts. Click* Advanced**, then Go to [Your Script Name] (unsafe).
Review the permissions (it will ask to manage your spreadsheets) and click* Allow**.
- Copy the URL:
After successful deployment, you will be given a* Web app URL**. This URL is your API endpoint.
- COPY THIS URL AND SAVE IT. It is the target your IoT devices will send their JSON data to. It will look something like this:
https://script.google.com/macros/s/AKfycby.../exec
Your serverless data gateway is now live!
Step 4: Building the AppSheet App from Your Google Sheet Data Source
Now we move from the backend to the frontend. We’ll use AppSheet to instantly create a powerful mobile and web application on top of the Google Sheet we just prepared.
-
Navigate to appsheet.com and sign in with the same Google account that owns the Google Sheet.
-
On your AppSheet homepage, click Create > App > Start with existing data.
-
Give your app a name, such as
Predictive Maintenance Monitor. -
Choose a category, like
ManufacturingorField Service. -
Click Choose your data.
-
In the file picker, select the
IoT_Predictive_Maintenance_DataGoogle Sheet you created. AppSheet will immediately begin analyzing your sheet and building a default app.
Within a minute, you’ll be dropped into the AppSheet editor with a functional app. AppSheet has intelligently inspected your column headers and inferred the data types.
Verify Column Types:
Before proceeding, it’s vital to ensure AppSheet has guessed the types correctly.
In the AppSheet editor, go to the* Data** tab on the left.
Select the* Telemetry** table.
Click on* Columns** to expand the column details.
-
Review each column’s type. Key things to check:
-
Timestampshould beDateTime. -
Temperature,Vibration,OperatingHoursshould beNumber. -
AlertTriggeredshould beYes/No. -
RecordIDshould be set as the Key. If it isn’t, check the box. For its initial value, use the formulaUNIQUEID(). This ensures every row has a unique key, which is fundamental for AppSheet to work correctly.
Your base app is now ready. You can already see a view of your (currently empty) data table and can even manually add new records using the + button in the app preview.
Step 5: Configuring AppSheet Views, Alerts, and Automated Workflows
This is where we add the intelligence. We’ll create custom views to visualize the data and build an automation bot that watches for anomalies and triggers alerts.
A. Create Insightful Views
The default table view is functional but not very insightful. Let’s create views that help technicians understand the data at a glance.
-
Dashboard View: Go to the UX tab. Add a new view, set its type to Dashboard. This view can combine several other views into one screen. You can add a chart view showing average temperature by
DeviceIDand another chart showing vibration trends over time. -
“Needs Attention” Slice: To isolate problematic machines, we’ll create a Slice.
Go to* Data > Slices** and create a new slice named Needs Attention.
- Set the source table to
Telemetry.
For the* Row filter condition**, enter an expression like: [AlertTriggered] = TRUE
Now, go back to* UX** and create a new view based on this Needs Attention slice. Call it “Alerts” and choose a Deck or Card view type to make the alerts stand out.
B. Build the Predictive Automation Bot
This bot is the heart of our predictive maintenance system. It will run every time a new piece of data arrives from our Apps Script.
-
Navigate to the Automation tab on the left.
-
Click Create a new bot.
-
Name the bot:
Monitor Machine Health. -
Configure the Event (The “When”):
Click* Configure event**.
Choose* Creates a new event**.
Set the* Event Type to Data Change and the Table** to Telemetry.
Ensure the data change type is set to* Adds only**. This means the bot triggers only when a new row is created.
- Add a Process (The “If”):
Click* Add a step and choose Create a custom step**.
- Name the step
Check for Anomaly.
Click* Add on the Run this process line and select Branch on a condition**.
For the* If this is true** condition, enter your predictive logic. This is where you define what constitutes an anomaly. For example:
OR([Temperature] > 90, [Vibration] > 2.5)
This expression triggers the process if the temperature exceeds 90 degrees OR the vibration level goes above 2.5 mm/s.
- Define the Tasks (The “Do”):
Under the If this is true branch, click* Add step**. Name it Trigger Alert.
Click* Add on the Run this task line and select Run a data action**.
Choose the action* Set row values**.
-
Set the column
AlertTriggeredto the valueTRUE. This action flags the problematic data row in our sheet and app. -
Now, add a second task to the same step. Click the
+under the task list.
Choose* Send a notification**.
Set the* To** field to the email address of a maintenance manager or a distribution list.
Customize the* Notification content**. You can use template variables to make it dynamic:
ALERT: Device <<[DeviceID]>> has exceeded safe operating limits. Temp: <<[Temperature]>>°C, Vibration: <<[Vibration]>>mm/s.
Save your bot. You have now created a complete, closed-loop system. When an IoT device sends data that breaches your defined thresholds, this bot will automatically flag the record and send a detailed notification to the right people, turning raw data into actionable intelligence.
Bringing the System to Life: A Practical Use Case
Theory and setup are one thing, but the real magic happens when the data starts flowing and the system begins to operate as a cohesive unit. Let’s walk through a tangible, end-to-end scenario to see how our IoT-powered AppSheet application prevents a costly failure before it even happens.
Scenario: Monitoring machine temperature and vibration
Imagine a critical piece of machinery on your factory floor—let’s say it’s a large industrial air compressor, “COMP-007”. This machine is vital, and unplanned downtime would halt an entire production line. We’ve fitted it with a simple IoT sensor package that measures two key health indicators:
-
Casing Temperature: Normal operation is between 60-80°C. Anything above 85°C suggests a cooling problem or excessive friction.
-
Vibration: Measured in millimeters per second (mm/s). The baseline is around 2.5 mm/s. A sustained reading above 5.0 mm/s could indicate a bearing failure is imminent.
Our IoT device is programmed to push a new reading for both metrics to our Sensor_Data Google Sheet every five minutes. A row in our sheet looks something like this: Timestamp: 2023-10-27 14:05:00, Machine_ID: COMP-007, Temperature: 76.5, Vibration: 2.8.
How AppSheet visualizes real-time sensor data
This is where the operator on the floor interacts with the system. They don’t need to see a raw spreadsheet; they have our AppSheet app on their tablet.
Inside the app, we’ve created a “Machine Status” dashboard view. This view is pointed directly at our Sensor_Data table. Instead of a simple table, we’ve configured it to show:
-
A Time Series Chart: This chart plots Temperature and Vibration over the last 24 hours for COMP-007. This allows the operator to spot trends at a glance. Is the temperature slowly creeping up? Is vibration becoming more erratic?
-
**Detail Cards: We use prominent cards to display the latest reading for each key metric.
-
Conditional Formatting Rules: This is the most critical part of the visualization. We’ve set up rules to dynamically change the color of the data points:
-
Green: Temperature < 80°C and Vibration < 4.5 mm/s (All clear).
-
Yellow: Temperature between 80-85°C or Vibration between 4.5-5.0 mm/s (Warning, keep an eye on it).
-
Red: Temperature > 85°C or Vibration > 5.0 mm/s (Critical alert threshold reached).
When the operator glances at the dashboard, a sea of green is good news. A flash of yellow or red immediately draws their attention to a potential problem, long before a catastrophic failure alarm sounds.
Triggering an automated alert and creating a maintenance ticket
At 14:30, a bearing inside COMP-007 begins to degrade rapidly. The sensor pushes a new reading: Temperature: 88.2, Vibration: 5.3. The instant this new row syncs to the Google Sheet, our [Architecting Autonomous Data Entry Apps with AppSheet and Building Self-Correcting Agentic Workflows with Vertex AI](https://votuduc.com/architecting-autonomous-data-entry-apps-with-appsheet-and-vertex-ai-p-20260322535129) bot springs into action.
Here’s the logic we built into the bot:
-
Event (The “If”): The bot is triggered on “Data Change” specifically for “Adds” to the
Sensor_Datatable. -
Condition (The “Filter”): It runs a check on the newly added row:
OR([Temperature] > 85, [Vibration] > 5.0). Our new data(88.2, 5.3)meets this condition. -
Process (The “Then”): Because the condition is true, the bot executes a pre-defined two-step process:
-
Send a Notification: It fires off a high-priority push notification to the “Maintenance Team” user group. The message is dynamic: “CRITICAL ALERT: COMP-007 is reporting high temperature (88.2°C) and vibration (5.3 mm/s). Please investigate immediately.”
-
**Create a Ticket: It runs an “Add a new row” action on our other table,
Maintenance_Tickets. It automatically populates a new ticket with key information pulled from the sensor data:
-
Machine_ID: COMP-007 -
Status: Open -
Priority: High -
Issue_Reported: “Automated Alert: High Temperature / Vibration Detected” -
Reported_Time:NOW()
The entire process, from sensor reading to a new, detailed maintenance ticket appearing in the system, takes less than a minute—with zero human intervention.
Logging the repair and closing the loop within the app
A technician on the maintenance team gets the push notification. She opens the AppSheet app and sees the new, high-priority ticket assigned to her team at the top of her list.
-
Acknowledge & Investigate: She taps the ticket, reviews the initial data, and changes the status from “Open” to “In Progress,” letting the supervisor know it’s being handled. She then heads to the machine.
-
Perform the Repair: After a quick inspection, she confirms a faulty bearing is the cause. She performs the replacement, cleans the housing, and powers the compressor back on. She monitors the live data in the app and sees the temperature and vibration levels return to the normal green zone.
-
Log the Work: Back in the ticket view within the app, she completes the record.
-
Action Taken: “Replaced primary motor output bearing. Cleaned and lubricated assembly.”
-
Parts Used: She selects “Bearing Kit #BK-451” from a related parts table.
-
Time Spent: 1.5 (hours).
-
Attach Photo: She uses her tablet’s camera to snap a quick photo of the new bearing in place and attaches it directly to the ticket for visual confirmation.
- Close the Loop: Finally, she changes the ticket
Statusto “Completed” and hits “Save.”
The ticket is now closed. All the data—from the initial automated alert to the parts used, time spent, and photographic evidence of the repair—is neatly stored in our Maintenance_Tickets Google Sheet. We now have a complete, searchable history of the event, which is invaluable for future analysis, inventory management, and auditing. The system has successfully turned raw IoT data into a closed-loop, actionable, and fully documented maintenance workflow.
Why This Google-Centric Stack is a Game-Changer
Before we dive into the nuts and bolts of building our application, it’s crucial to understand why this specific combination of Google Sheets and AppSheet is more than just a convenient choice—it’s a strategic one. This stack fundamentally changes the accessibility of IoT and predictive maintenance, moving it from the exclusive domain of enterprise-level budgets and specialized development teams into the hands of the people who need it most. It’s about democratizing data-driven operations.
Rapid development and deployment speed
In a traditional software development lifecycle, the journey from an idea to a functional application is a long and winding road involving database architects, backend developers, frontend designers, and DevOps engineers. The AppSheet and Google Sheets model shatters this paradigm.
Your Google Sheet isn’t just a data store; it’s the blueprint for your application. AppSheet’s intelligent platform inspects your columns, data types, and table names to automatically generate a functional baseline app with logical views and forms. This means you can go from a structured spreadsheet to a working mobile application in minutes, not months.
The real velocity, however, comes from iteration. Need to track a new sensor metric? Add a column to your Sheet. Want to create a new dashboard for supervisors? Configure it in the visual AppSheet editor. Changes are reflected in the live application almost instantly. This eliminates the friction and delay of conventional deployment cycles, allowing you to build, test, and refine your tool in direct response to feedback from the field.
Cost-effectiveness and scalability for small to medium operations
Let’s be blunt: custom software is expensive. The cost of development, hosting, and ongoing maintenance can be prohibitive, especially for small to medium-sized operations looking to experiment with predictive maintenance. This Google-centric stack flips the cost model on its head.
Most organizations already operate within the Automatically create new folders in Google Drive, generate templates in new folders, fill out text automatically in new files, and save info in Google Sheets ecosystem, meaning your primary data backend—Google Sheets—is effectively free. You are leveraging infrastructure and tools you already pay for. AppSheet’s licensing is a predictable, per-user cost that is a fraction of what you would pay for a single developer’s salary, let alone an entire team.
This approach also offers a pragmatic scaling path. While a single Google Sheet won’t power a global factory network, it is more than capable of handling the thousands of data points generated by dozens of machines—the sweet spot for many businesses. As your needs grow, the architecture allows for a graceful transition. You can upgrade your backend to a more robust database like Google Cloud SQL while keeping your user-facing AppSheet application, preserving the user experience and business logic you’ve already built.
Empowering your on-site teams with actionable data
Data that lives in a spreadsheet is passive. It requires someone to open it, interpret it, and decide on a course of action. An application, on the other hand, makes data active. This is the most critical transformation this stack enables.
Your on-site technicians and maintenance crews don’t work at a desk; they work on the floor, next to the machinery. An AppSheet app puts vital information directly into their pocket on a device they already use every day. Instead of deciphering rows of sensor readings, they see a clean interface with color-coded alerts: “Machine A: Vibration levels critical. Inspect immediately.”
This creates a powerful feedback loop. The app doesn’t just push data out; it pulls data in. A technician can use their phone to:
-
Log a completed maintenance task.
-
Scan a part’s barcode to update inventory.
-
Capture a photo of a worn-out component and attach it to a work order.
This information flows instantly back to the Google Sheet, enriching your dataset and improving the accuracy of your predictive models. You’re not just giving your team a report; you’re giving them a tool that integrates seamlessly into their workflow, turning raw data into decisive, on-the-spot action.
Conclusion: From Raw Data to Actionable Intelligence
We’ve journeyed from the raw, chaotic stream of sensor data to a polished, intelligent application that puts predictive power directly into the hands of your maintenance teams. By harnessing the simplicity of Google Sheets and the rapid development capabilities of AppSheet, you’ve built more than just an app; you’ve created a complete, end-to-end system for proactive operations.
Recap of the end-to-end predictive maintenance workflow
Let’s take a moment to appreciate the powerful workflow you’ve constructed. You started at the source and built a seamless pipeline for transforming data into decisions:
-
Data Ingestion: We configured our IoT devices to push critical operational data—like temperature, vibration, and runtime hours—directly into a structured Google Sheet, which acts as our accessible, no-fuss database.
-
Data Logic & Analysis: Within Google Sheets, we implemented the “predictive” logic. Using formulas and conditional formatting, we established thresholds and rules to automatically flag assets that are behaving outside of normal parameters, effectively predicting potential failures before they occur.
-
Application Layer: We connected AppSheet to our Google Sheet, instantly transforming our static data into a dynamic, interactive mobile and web application. We built views to display asset status, highlight at-risk equipment, and capture maintenance logs.
-
Action & Notification: Finally, we closed the loop with AppSheet’s automation features. When our Google Sheet flags an asset, the app automatically triggers alerts and notifications, empowering technicians to intervene with the right information at the right time.
You’ve successfully democratized the process of building a sophisticated IoT solution, proving that you don’t need a massive budget or a dedicated development team to start making data-driven decisions.
Next steps for enhancing your application
Your application is a powerful foundation, but it’s just the beginning. The beauty of this stack is its extensibility. As your confidence and requirements grow, consider these enhancements to take it to the next level:
-
Advanced Anomaly Detection: Move beyond simple thresholds. Use Google Apps Script to run more complex statistical calculations on your data rows as they arrive. You could calculate rolling averages or standard deviations to spot more subtle anomalies that a fixed threshold might miss.
-
Richer Data Integrations: Your maintenance app doesn’t have to live in a silo. Use AppSheet’s data integration capabilities to connect to other sources. Pull in spare parts inventory from another sheet to see if you have the necessary components on hand, or connect to a technician schedule to intelligently assign work orders.
-
Improved Field Usability: Enhance the technician’s experience. Add barcode or NFC scanning to quickly pull up an asset’s record in the field. Enable offline mode so that maintenance logs can be captured even in areas with poor connectivity and synced later.
-
Automated Work Order Generation: Take your automations a step further. Instead of just sending a notification, configure a bot that automatically creates a new “Work Order” record in another table, pre-populates it with asset details, and assigns it to the appropriate team lead.
Ready to scale your architecture? Book a GDE discovery call
The Google Sheets and AppSheet combination is brilliant for rapid prototyping and small-to-medium scale deployments. But what happens when your “few” sensors become a “fleet” of thousands? What if you need to process millions of data points per day and run sophisticated machine learning models?
When you reach that inflection point, it’s time to graduate to a production-grade architecture on Google Cloud. This is the natural evolution of your prototype, swapping out components for their infinitely scalable counterparts:
-
Google Sheets becomes BigQuery, a petabyte-scale data warehouse.
-
Sheet Formulas become Building Self Correcting Agentic Workflows with Vertex AI, for training and deploying custom ML models.
-
Direct data entry becomes IoT Core and Pub/Sub for secure, scalable data ingestion.
Navigating this transition can be complex, but you don’t have to do it alone. If you’re ready to explore how to transform your successful prototype into an enterprise-grade solution, let’s talk.
Book a complimentary discovery call with a Google Developer Expert to map out a cloud architecture that fits your specific operational needs and sets you up for future growth.


Stop Doing Manual Work. Scale with AI.
Want to turn these blog concepts into production-ready reality for your team?
Table Of Contents
Portfolios
Related Posts
Quick Links
Legal Stuff