

Building an AI E-commerce Growth Advisor in Google Chat


For e-commerce founders, more data often leads to more anxiety, not more clarity. Learn how to escape analysis paralysis and turn overwhelming metrics into profitable action.

The Founder’s Dilemma: Data Overload and Decision Paralysis
If you’re running an e-commerce business, you’re swimming in data. Every click, every purchase, every abandoned cart generates a data point. Shopify, Google Analytics, Meta Ads, Klaviyo—each platform offers a firehose of metrics, charts, and reports. In theory, this data is the key to unlocking explosive growth. In reality, it’s often the source of a creeping, persistent anxiety.
You have the numbers, but do you have the answers? More data doesn’t automatically translate to more clarity. It can lead to the opposite: a state of analysis paralysis where you’re so busy trying to interpret the signals that you fail to act. You’re constantly toggling between tabs, trying to correlate a dip in ad spend with a spike in bounce rate, wondering if a 10% increase in ‘add to carts’ is a victory or a vanity metric if checkout completions are flat. This isn’t a data problem; it’s an insights and actionability problem.
Why Traditional Dashboards Are Failing E-commerce Leaders
Dashboards were a revolutionary step forward, centralizing information into a single view. They are essential for monitoring the health of your business, but they are fundamentally passive tools built for a previous era. For the modern, fast-moving e-commerce leader, they have several critical limitations:
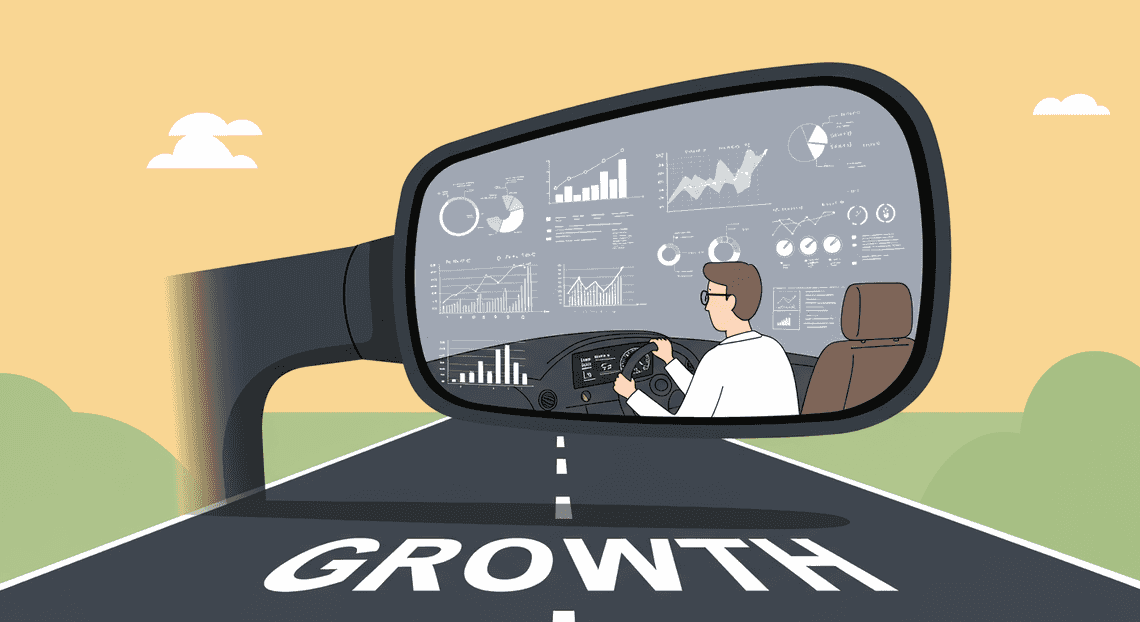
- They Are Reactive, Not Proactive: A dashboard is a rearview mirror.
-
They Operate in Silos: Your Shopify data doesn’t natively speak to your Google Ads data. Your Klaviyo engagement metrics are isolated from your inventory levels. The founder or marketing lead becomes the human API, manually stitching together narratives from these disparate sources. This process is not only time-consuming but also prone to misinterpretation. You’re trying to solve a multi-variable equation by looking at each variable on a separate piece of paper.
-
**They Drown Signal in Noise: A typical dashboard presents dozens of metrics at once. Which one is the most important today? Is that 3% drop in conversion rate a statistical blip, or is it the first sign of a critical bug in your checkout flow? The cognitive load required to constantly filter the critical signals from the background noise is immense and exhausting.
-
They Lack Actionable Context: A metric like “Average Order Value: $92.30” is just a number. A dashboard presents this number, but it doesn’t tell you the story behind it. It doesn’t tell you that your AOV is up 15% month-over-month because a new product bundle is performing exceptionally well, and that you should double down on promoting it. Dashboards provide data; they rarely provide direction.
The Vision: A Conversational AI for Strategic Growth
Imagine a different paradigm. Instead of you going to the data, the critical insights come to you. Instead of staring at charts, you have a conversation with an expert advisor who has already done the heavy lifting. This is the vision for our AI Growth Advisor, built directly into the workflow you already use: Google Chat.
This isn’t about replacing dashboards. It’s about augmenting them with a layer of proactive intelligence. We’re shifting the focus from data retrieval to decision support.
Here’s what that looks like in practice:
-
Proactive and Prescriptive: The AI doesn’t wait for you to ask. It monitors your key systems 24/7 and pushes alerts and recommendations directly to you.
-
Instead of you noticing a drop in sales… you get a message: “Heads up: Revenue from the ‘Spring Collection’ campaign is down 30% in the last 48 hours. The click-through rate on our main ad creative has dropped significantly. Recommend pausing it and reallocating budget to the top-performing ‘Outdoor Adventure’ ad set.”
-
A True Data Synthesizer: The AI acts as that central brain, connecting the dots between your siloed platforms.
-
Instead of you manually correlating data… you can ask: “Why were sales down last Tuesday?” The AI responds: “Sales dipped by 15% last Tuesday, coinciding with our primary email campaign landing in spam folders for Gmail users. Open rates dropped from a 22% average to 4%. We should review our email authentication records.”
-
Context on Command: The AI understands natural language and the context of your business. You can interrogate your data as easily as you’d message a colleague.
-
Instead of building a complex report… you can simply ask: “What was our best-selling product for first-time customers last month?” or “Compare our return on ad spend for Google vs. Meta in Q2.”
The goal is to transform your relationship with data from one of adversarial archaeology—endlessly digging for artifacts—to a collaborative partnership. This AI advisor becomes a member of your team, tirelessly analyzing, synthesizing, and recommending, freeing you up to do what you do best: make strategic decisions and grow your business.
Our Solution The Weekly AI-Powered Growth Briefing
Dashboards are graveyards of good intentions. We build them, we promise to check them, and then we forget them. The critical signals get lost in a sea of charts that require manual interpretation and context-switching. Our approach flips this model on its head. Instead of you pulling data, we have an AI agent that synthesizes, analyzes, and pushes a concise, actionable briefing directly to your team in Google Chat every Monday morning.
It’s not just data; it’s a conversation starter. It’s the modern, automated equivalent of the weekly performance meeting, delivered asynchronously.
What It Is A Performance Narrative Delivered in Google Chat
At its core, the briefing is a weekly performance narrative. We’re moving beyond isolated data points ({ "revenue": 10000 }) and into the realm of storytelling. The AI agent doesn’t just report the numbers; it contextualizes them, weaving them into a coherent story about what happened last week and why it matters.
Why Google Chat? Because that’s where work happens. By delivering insights directly into the team’s communication hub, we achieve several key goals:
-
Visibility: The most important metrics are front-and-center, impossible to ignore.
-
Reduced Friction: No need to open another tab, log into another service, or remember which dashboard to check.
-
Collaboration: The briefing becomes an object of discussion. Team members can immediately thread replies, ask questions, and assign action items right below the report.
The format is a simple, scannable Google Chat Card, designed for quick consumption but with enough depth to be meaningful. It highlights wins, flags potential issues, and provides a top-level summary generated by a Large Language Model (LLM).
Key Metrics at a Glance Revenue CPA and LTV
You can’t track everything, and trying to do so leads to analysis paralysis. We focus on a trifecta of metrics that provide a holistic view of e-commerce health: growth, efficiency, and long-term value.
-
Revenue: The ultimate indicator of top-line growth. The briefing presents total weekly revenue and compares it to the previous week (WoW) and the trailing four-week average. This helps distinguish a one-off spike from a genuine trend.
-
Cost Per Acquisition (CPA): The pulse of marketing efficiency. It answers the question, “How much are we paying to acquire each new customer?” A rising CPA can silently erode profitability, even when revenue is growing. Tracking this weekly prevents inefficient ad spend from spiraling out of control.
-
Lifetime Value (LTV): The measure of business sustainability. Are we acquiring customers who make repeat purchases, or are we churning through one-time buyers? We calculate a 60-day LTV for recent customer cohorts to provide an early indicator of customer quality. A healthy LTV-to-CPA ratio is the bedrock of a scalable e-commerce business.
These three metrics create a balanced scorecard. Revenue tells us if we’re growing, CPA tells us if that growth is profitable, and LTV tells us if it’s sustainable.
From Raw Data to Actionable Insights An Example
This is where the magic happens. The system doesn’t just present the three metrics; it synthesizes them into a cohesive insight. Let’s walk through a scenario.
Imagine the underlying data for the week looks like this:
-
Revenue: $22,500 (+15% WoW)
-
CPA: $55 (+30% WoW)
-
60-Day LTV: $115 (-10% vs. previous cohort)
A traditional dashboard would show three separate trend lines going in different directions, leaving the interpretation up to you. Our AI Growth Advisor, however, connects the dots and delivers the following message in Google Chat:
Growth Bot 🤖

**Weekly Growth Briefing: Oct 9 - Oct 15, 2023**

Here's your AI-powered summary of last week's performance.

**Highlights ✨**

*   **Revenue: $22,500** (🟢 +15% WoW). Strong top-line growth, exceeding the monthly average.

**Areas for Review 📉**

*   **CPA: $55** (🔴 +30% WoW). Acquisition costs are rising sharply, significantly outpacing revenue growth.

*   **60-Day LTV: $115** (🟡 -10% vs. prior cohort). The value of newly acquired customers is trending down.

**AI Narrative & Recommendation 💡**

While revenue growth is strong, the underlying metrics suggest a potential issue with marketing efficiency. The sharp increase in CPA combined with a decrease in LTV indicates we may be acquiring lower-quality customers at a higher price.

**Action Item:** Review performance of the new "Fall Sale" campaign on Platform X. It's likely driving volume but at an unsustainable cost. Consider reallocating budget to higher-performing channels or refining audience targeting.
This briefing transforms raw, disconnected numbers into a clear, actionable narrative. It identifies the “what” (revenue is up, but efficiency is down) and provides a hypothesis for the “why” (the new campaign is likely the cause), along with a concrete next step. This is the difference between data reporting and decision intelligence.
The Technical Architecture Behind the Scenes
At its core, our AI Growth Advisor is a sophisticated pipeline that transforms raw, disparate data into actionable business intelligence, delivered conversationally. The architecture can be broken down into three distinct layers: a Data Consolidation Layer, an Intelligence Layer, and a Presentation Layer. Let’s dissect each component to understand how they work in concert.
Data Consolidation with BigQuery and Antigravity 2.0
The foundation of any credible AI system is the data it’s trained on and analyzes. For an e-commerce advisor, this means having a clean, comprehensive, and up-to-date view of the entire business. This is our single source of truth.
BigQuery as the Data Warehouse: We chose Google BigQuery as our central data warehouse for several key reasons. Its serverless architecture means we don’t manage infrastructure, and it scales seamlessly from gigabytes to petabytes. For an e-commerce business with spiky traffic and ever-growing datasets (sales transactions, user clickstreams, ad impressions, inventory logs), this is non-negotiable. BigQuery’s columnar storage and blazing-fast SQL engine allow us to run complex analytical queries in seconds, which is crucial for a real-time chat interface.
Antigravity 2.0 as the ETL Engine: Getting data into BigQuery is where our custom ETL framework, codenamed “Antigravity 2.0,” comes in. It’s a collection of scheduled Cloud Functions and Dataflow jobs that act as a universal data connector. It systematically pulls data from various platform APIs:
-
Sales & Product Data: Shopify or Magento APIs
-
Marketing & Ad Spend: Google Ads, Meta Ads, TikTok Ads APIs
-
Website Analytics: Google Analytics 4 (GA4) BigQuery Export
-
Customer Support: Zendesk or Intercom APIs
Antigravity doesn’t just dump this data. It cleanses, transforms, and standardizes it into a unified schema. For example, it resolves customer identities across different platforms and attributes sales to specific marketing campaigns. The result is a set of pristine, interconnected tables in BigQuery, ready for analysis. A typical query might join multiple sources like this:
SELECT

c.campaign_name,

SUM(s.order_total) AS total_revenue,

COUNT(DISTINCT s.customer_id) AS unique_customers

FROM

`project.dataset.sales_orders` AS s

JOIN

`project.dataset.marketing_campaigns` AS c

ON

s.utm_campaign = c.campaign_id

WHERE

s.order_date BETWEEN '2024-07-01' AND '2024-07-31'

GROUP BY

c.campaign_name

ORDER BY

total_revenue DESC;
Without this consolidated base, our AI would be flying blind.
Generating Human-Like Narratives with Gemini 3.5
This is the intelligence layer where raw numbers are transmuted into strategic advice. We leverage the powerful reasoning capabilities of Google’s Gemini 3.5 Pro model to act as a brilliant, on-demand data analyst. The process is a sophisticated two-step dance orchestrated by a backend service (running on Cloud Run).
Step 1: Natural Language to SQL Generation
When a user asks, “Which marketing campaigns had the best ROI last month?”, our backend doesn’t use simple keyword matching. Instead, it constructs a detailed prompt for Gemini. This prompt includes the user’s question, the relevant BigQuery table schemas, and a clear instruction to generate a valid BigQuery SQL query.
-- System Prompt Example (Simplified) --

You are an expert Google BigQuery data analyst for an e-commerce company.

Your task is to convert the user's question into a valid BigQuery SQL query.

Here are the available tables and their schemas:

- `sales_orders` (order_id, order_date, customer_id, order_total, utm_campaign)

- `marketing_campaigns` (campaign_id, campaign_name, start_date, end_date, total_spend)

User's Question: "Which marketing campaigns had the best ROI last month?"

Generate the BigQuery SQL to answer this question. Calculate ROI as (Total Revenue - Total Spend) / Total Spend.
The backend then safely executes the Gemini-generated SQL against BigQuery.
Step 2: Data to Narrative Synthesis
The raw query result, typically a JSON array, is just a table of numbers. It’s not an “insight.” So, we feed this raw data back to Gemini in a second API call. This time, the prompt is different.
-- System Prompt Example (Simplified) --

You are an expert e-commerce growth advisor.

You are communicating with the marketing director via Google Chat.

Your tone should be concise, data-driven, and actionable.

Based on the following data, write a brief summary of marketing campaign performance last month.

Highlight the top-performing campaign and suggest one potential action item.

Data:

{

"results": [

{"campaign_name": "Summer Sizzle 2024", "roi": 5.7},

{"campaign_name": "Q3 Influencer Push", "roi": 3.1},

{"campaign_name": "Evergreen SEO Content", "roi": -0.2}

]

}
Gemini’s advanced reasoning allows it to interpret the data, identify the “Summer Sizzle 2024” campaign as the winner, calculate the difference, and formulate a human-readable summary. This two-step process ensures both analytical accuracy (from the SQL) and communicative clarity (from the narrative synthesis).
Delivering Insights Seamlessly via the Google Chat API
The final piece of the puzzle is the presentation layer. An insight is useless if it’s poorly delivered. Instead of just dumping a wall of text into the chat, we use the Google Chat API’s Card V2 format to create rich, interactive messages.
This API allows us to send structured JSON payloads that render as visually organized cards within the chat interface. Our backend service takes the narrative generated by Gemini and formats it into one of these cards.
A well-designed card can include:
-
Headers: A clear title for the analysis (e.g., “Monthly Marketing ROI Report”).
-
Widgets: Key metrics displayed prominently using
decoratedTextwidgets with icons. -
Dividers: Horizontal rules (
<hr />) to visually separate sections. -
Text Paragraphs: The full narrative from Gemini.
-
Buttons: Interactive elements for follow-up actions like “Drill down by channel” or “Export data to Sheets,” which can trigger subsequent API calls.
Here is a simplified JSON payload for a Google Chat card:
{

"cardsV2": [

{

"cardId": "marketing-roi-card",

"card": {

"header": {

"title": "Marketing Performance Summary",

"subtitle": "Last Month's ROI Analysis"

},

"sections": [

{

"header": "Top Performer",

"widgets": [

{

"decoratedText": {

"startIcon": { "knownIcon": "STAR" },

"text": "<b>Summer Sizzle 2024:</b> 5.7x ROI"

}

}

]

},

{

"widgets": [

{

"textParagraph": {

"text": "The 'Summer Sizzle 2024' campaign was our clear winner last month, significantly outperforming other initiatives. We should consider reallocating budget from lower-performing campaigns to double down on this successful strategy for the next cycle."

}

}

]

}

]

}

}

]

}
This approach transforms the chat from a simple command line into a dynamic and intuitive dashboard, making the AI’s insights immediately digestible and actionable for the entire team.
The Strategic Impact From Reactive Analysis to Proactive Strategy
Building an AI-powered advisor is more than a technical exercise in connecting APIs; it’s a fundamental shift in how your organization interacts with its own data. The traditional paradigm of business intelligence involves powerful, but passive, dashboards. They are vast libraries of information that require you to know which book to pull off the shelf, which chapter to read, and how to interpret the text. This model is inherently reactive. You go to the data when you suspect a problem or need to build a report.
An AI growth advisor integrated into a conversational platform like Google Chat flips this model on its head. It becomes a proactive strategist, a member of the team that doesn’t wait to be asked. It surfaces critical insights, anomalies, and opportunities directly within the flow of work. This transforms your company’s posture from looking in the rearview mirror to actively scanning the road ahead.
Saving C-Suite Time and Focusing on What Matters
An executive’s most constrained resource is their attention. Forcing them to log into a complex BI platform, apply filters, and hunt for a specific metric is an inefficient use of their time. This friction often leads to a bottleneck where leaders must ask an analyst for a report, introducing delays and breaking the flow of strategic thought.
Our Google Chat advisor short-circuits this entire process. It delivers the “so what?” directly to leadership. Instead of a dense dashboard, they receive a concise, natural language summary:
-
Executive Summaries on Demand: A simple query like, “@GrowthBot what was our AOV for the Black Friday campaign?” gets an immediate, quantified answer, not a link to a dashboard.
-
Proactive Alerts: The bot can pre-emptively flag critical changes. “Heads up: Top-line revenue is up 7% week-over-week, driven by a 20% surge in the ‘Outdoor Gear’ category. However, the overall site conversion rate dropped by 0.5%.”
This allows leadership to spend their cognitive energy on high-value strategic questions (”Why did the conversion rate drop and what’s our plan to fix it?”) rather than low-value data discovery (“Where is that report from last quarter?”). It shortens the cycle from data to decision from days to minutes.
Fostering a Data-Driven Culture Across the Team
A “data-driven culture” is one of the most sought-after but elusive goals for modern businesses. It doesn’t magically appear when you purchase an expensive analytics suite. It’s cultivated by making data accessible, understandable, and integral to daily conversations.
By integrating the AI advisor into Google Chat, you meet your team exactly where they are working. This dramatically lowers the barrier to entry for engaging with data:
-
Democratized Access: A marketing specialist can check campaign performance without leaving the chat where they coordinate with their team. A merchandiser can query stock levels for a trending product while discussing promotions.
-
A Common Language: When anyone can ask “@GrowthBot show me top-selling products this week” and get an immediate, shared view of reality, data ceases to be the exclusive domain of the analytics department. It becomes a common language that underpins stand-ups, planning sessions, and ad-hoc discussions.
This approach removes the intimidation factor of complex tools and empowers every team member to back their intuition and decisions with real numbers, making data a collaborative, daily habit rather than a siloed function.
How Weekly Nudges Drive Smarter Business Decisions
The most significant strategic advantage of an AI advisor is its ability to create a proactive rhythm for the entire business. Human nature means that even the most critical dashboards are easily forgotten amidst the crush of daily tasks. Important trends can go unnoticed simply because no one remembered to look.
The AI advisor solves this “out of sight, out of mind” problem with automated, scheduled nudges. Imagine every Monday morning, the e-commerce team’s Google Chat space receives a crisp, automated briefing:
-
Weekly Performance Snapshot: A clear summary of core KPIs like Revenue, Conversion Rate, and Average Order Value versus the previous week and targets.
-
Anomaly Detection: Automated flags for unusual activity, such as “Customer acquisition cost from Google Ads increased by 35% last week, far exceeding the normal variance.”
-
Opportunity Surfacing: Insights that highlight potential wins, like “The ‘Men’s Trail Running Shoes’ sub-category has seen a 50% increase in ‘add to carts’ with no corresponding marketing spend.”
This consistent cadence ensures that key business drivers are always top-of-mind. It turns data analysis from a periodic, reactive event (e.g., end-of-month reporting) into a continuous, forward-looking process. These nudges are more than just data points; they are conversation starters that trigger immediate, smarter, and more collaborative business decisions week after week.
Build Your Own E-commerce Growth Engine
You’ve now walked through the architectural blueprint for transforming raw e-commerce data into a proactive, AI-powered advisor within Google Chat. This isn’t just a technical exercise; it’s a fundamental shift in how you interact with your business intelligence. By moving insights from static dashboards to dynamic, conversational workflows, you empower your teams to make smarter, faster decisions that directly impact your bottom line.
Key Takeaways for Scaling Your Analytics
The solution we’ve built is more than the sum of its parts. It’s a scalable pattern for embedding intelligence directly into your operational fabric. As you adapt this framework for your own needs, keep these core principles in mind:
-
Centralize Your Data Gravity: The entire system hinges on a clean, consolidated data warehouse like BigQuery. Before you write a single line of AI code, ensure your data foundation is solid. A single source of truth is non-negotiable for generating trustworthy insights.
-
AI is the Interpreter, Not Just the Analyst: We used a Large Language Model to translate complex query results into natural language. The real power lies in this interpretation layer. It bridges the gap between raw data and human understanding, making analytics accessible to everyone, not just data scientists.
-
Meet Users Where They Work: The choice of Google Chat as the delivery interface is deliberate. Pushing actionable alerts and insights into a collaborative environment reduces friction and accelerates the time from insight to action. The best dashboard is the one you don’t have to open.
-
Architecting an Event-Driven Workspace with PubSub Firebase and Gemini is Key to Proactivity: By using Google Cloud Functions triggered by events (like Pub/Sub messages or Cloud Scheduler), the system becomes proactive. It doesn’t wait to be asked; it monitors your business and reports on significant changes, anomalies, or opportunities as they happen.
-
Start Small, Design for Scale: The serverless components—Cloud Functions, [Building Self Correcting Agentic Workflows with Building Self-Correcting Agentic Workflows with Vertex AI](https://votuduc.com/building-self-correcting-agentic-workflows-with-vertex-ai-p-20260321542526), and BigQuery—allow you to start with a minimal footprint and scale seamlessly as your data volume and user base grow. This architecture is built to evolve with your business, from a startup to an enterprise.
Ready to Scale Your Architecture? Book a GDE Discovery Call
The framework detailed in this guide provides a powerful starting point. However, scaling this solution to handle enterprise-level complexity, integrating with bespoke internal systems, or fine-tuning models for unique business challenges requires specialized expertise.
Perhaps you need to:
-
Incorporate multiple, disparate data sources beyond standard e-commerce platforms or Google Analytics.
-
Implement sophisticated security controls and data governance for sensitive information.
-
Optimize your BigQuery queries and Vertex AI calls for maximum performance and cost-efficiency at a massive scale.
-
Develop custom AI reasoning chains to answer highly specific questions about your unique business model.
This is where we can help. Our team, led by Google Developer Experts in Cloud and AI, specializes in architecting and deploying robust, scalable data and AI solutions. We can help you navigate the complexities of a production-level implementation, ensuring your AI Growth Advisor is not just a proof-of-concept, but a reliable, enterprise-grade asset.
If you’re ready to take your e-commerce analytics to the next level, let’s talk.
Book Your Complimentary GDE Discovery Call Today →
Appendix: Sample Code & Prompts
To make the concepts discussed more concrete, here are some illustrative examples of the key components in action. These snippets are designed to be a starting point for your own implementation.
1. Sample Cloud Function (JSON-to-Video Automated Rendering Engine) for Daily Summary
This simplified Python function demonstrates the core logic: querying BigQuery, getting an interpretation from Vertex AI, and posting the result to Google Chat.
import functions_framework

import os

import json

import requests

from google.cloud import bigquery

import vertexai

from vertexai.generative_models import GenerativeModel

# --- Configuration ---

PROJECT_ID = os.environ.get("GCP_PROJECT")

LOCATION = "us-central1" # Or your preferred region

BIGQUERY_DATASET = "ecommerce_analytics"

CHAT_WEBHOOK_URL = os.environ.get("CHAT_WEBHOOK_URL")

# --- Initialize Clients ---

vertexai.init(project=PROJECT_ID, location=LOCATION)

bigquery_client = bigquery.Client()

model = GenerativeModel("gemini-1.0-pro")

@functions_framework.http

def generate_daily_summary(request):

"""

An HTTP-triggered Cloud Function that generates and posts a daily sales summary.

"""

# 1. Query BigQuery for relevant data

query = f"""

SELECT

product_name,

SUM(quantity) as total_sold,

ROUND(SUM(price * quantity), 2) as total_revenue

FROM

`{PROJECT_ID}.{BIGQUERY_DATASET}.sales_daily`

WHERE

sale_date = CURRENT_DATE()

GROUP BY

product_name

ORDER BY

total_revenue DESC

LIMIT 5;

"""

try:

query_job = bigquery_client.query(query)

results = query_job.result()

data_for_prompt = "\n".join(

[f"- {row.product_name}: {row.total_sold} units, ${row.total_revenue:.2f} revenue" for row in results]

)

except Exception as e:

print(f"Error querying BigQuery: {e}")

return "BigQuery query failed", 500

# 2. Use Vertex AI to interpret the data

prompt = f"""

You are an expert e-commerce analyst providing a daily briefing.

Your tone should be insightful and slightly urgent.

Based on the following sales data for today, write a concise summary for the executive team.

Highlight the top-performing product and call out the total revenue generated by the top 5 products.

Today's Top 5 Products by Revenue:

{data_for_prompt}

Begin your summary with "📈 Daily Sales Snapshot:".

"""

try:

response = model.generate_content(prompt)

summary_text = response.text

except Exception as e:

print(f"Error calling Vertex AI: {e}")

return "Vertex AI call failed", 500

# 3. Post the summary to Google Chat

chat_message = {

"cardsV2": [{

"cardId": "daily_summary_card",

"card": {

"header": {

"title": "E-commerce Growth Engine",

"subtitle": "Daily Performance Alert",

"imageUrl": "https://www.gstatic.com/images/icons/material/system_gm/2x/analytics_gm_blue_24dp.png",

"imageType": "CIRCLE"

},

"sections": [{

"widgets": [{

"textParagraph": {

"text": summary_text

}

}]

}]

}

}]

}

try:

response = requests.post(CHAT_WEBHOOK_URL, data=json.dumps(chat_message), headers={'Content-Type': 'application/json'})

response.raise_for_status() # Raises an exception for bad responses (4xx or 5xx)

except requests.exceptions.RequestException as e:

print(f"Error posting to Google Chat: {e}")

return "Google Chat post failed", 500

return "Summary sent successfully!", 200
2. Example Anomaly Detection Prompt
For a proactive anomaly detection function, the prompt would be structured differently to guide the model’s reasoning.
Input Data (from a BigQuery query that found an outlier):
Product: 'Classic Leather Wallet', Yesterday's Sales: 15 units, 7-Day Average Sales: 14.5 units, Today's Sales: 85 units.
LLM Prompt:
You are a vigilant e-commerce monitoring AI. You detect and explain significant anomalies in sales data.

Analyze the following data point and determine if it constitutes a significant anomaly.

If it is, write a brief, actionable alert for the marketing team. Explain WHY it's an anomaly (e.g., "sales are 486% above the weekly average") and suggest a potential next step.

Data:

- Product: 'Classic Leather Wallet'

- Yesterday's Sales: 15 units

- 7-Day Average Sales: 14.5 units

- Today's Sales: 85 units

Format your response as a single paragraph starting with "🚨 Anomaly Detected:".
Expected AI Output:
🚨 Anomaly Detected: Sales for the 'Classic Leather Wallet' have surged to 85 units today, a 486% increase over the 7-day average of 14.5 units. This spike is highly unusual. The marketing team should investigate if a recent campaign, social media mention, or influencer post is driving this sudden demand to capitalize on the trend.


Stop Doing Manual Work. Scale with AI.
Want to turn these blog concepts into production-ready reality for your team?
Table Of Contents
Portfolios
Related Posts
Quick Links
Legal Stuff