

Debugging and Optimizing Autonomous Web Agents with Chrome DevTools


When an autonomous web agent fails, the challenge isn’t finding the broken line of code, but deciphering the flawed reasoning that led to its mistake.

The Challenge of Debugging Autonomous Web Workflows
Autonomous web agents represent a monumental leap from traditional, imperative [Automated Job Creation in Real Time Jobber and Google Sheets Integration from Gmail](https://votuduc.com/Automated-Job-Creation-in-Jobber-from-Gmail-p115606) scripts. Instead of following a rigid, step-by-step recipe, they perceive, reason, and act upon the dynamic environment of a web page. This sophistication, however, introduces a new class of debugging challenges that can leave even seasoned developers scratching their heads. When an agent fails, the question is rarely “Which line of code broke?” but rather “Why did the agent decide to do the wrong thing?”
Why Traditional Debugging Tools Fall Short for Agents
The trusty debugger statement and step-through debuggers, while indispensable for conventional code, often prove inadequate for diagnosing agent failures. The core issue is a paradigm mismatch: these tools were built to inspect a predictable, linear flow of logic, not the emergent behavior of a decision-making entity interacting with a chaotic, ever-changing DOM.
Here’s where the old playbook fails:
-
**The “Black Box” of Intent: A traditional debugger can show you that
element.click()was called, but it can’t tell you why the agent chose that specific element out of dozens of possibilities. The agent’s internal state—its goals, its understanding of the page, its evaluation of different actions—is often an opaque model or a complex decision tree that isn’t represented in a simple call stack. -
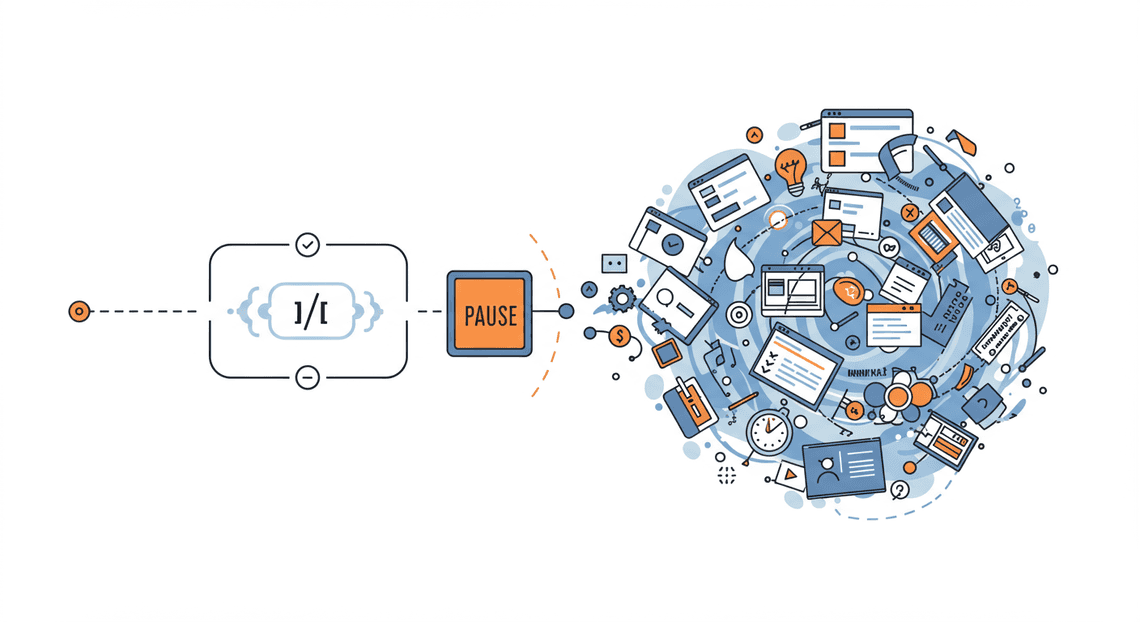
The Observer Effect: Pausing execution with a breakpoint fundamentally alters the agent’s environment. A modal dialog might disappear, a timed-out session might be reset, or a crucial animation might complete, inadvertently “fixing” the very state that caused the initial error. You can’t reliably debug a race condition by stopping the race.
-
Ephemeral State and DOM Volatility: An agent’s “world” is the DOM at a specific millisecond. A failure might be caused by an element that was briefly visible, obscured, or in a disabled state. By the time you attach a debugger, that state is gone forever. Replicating the exact sequence of network events, render timings, and user interactions that led to the failure is often next to impossible.
-
The Sheer Volume of Actions: A simple task like “book a flight” can involve hundreds of micro-steps for an agent: observing the screen, identifying elements, typing text, handling spinners, and making decisions. Manually stepping through this firehose of actions is not just impractical; it’s an ineffective way to find the single flawed decision in a sea of correct ones.
The High Cost of Flaky Automated Quote Generation and Delivery System for Jobber Scripts
When an autonomous agent is unreliable, the consequences extend far beyond a simple failed test case. The cost of “flakiness” is a tax on productivity, data integrity, and confidence in the entire Automated Work Order Processing for UPS stack.
-
Developer Time Sink: Debugging non-deterministic failures is one of the most frustrating and time-consuming tasks in software development. Hours or even days can be lost trying to reproduce a bug that only appears 1 in every 20 runs, draining resources that could be spent on building valuable features.
-
Corrupted Data and Processes: A “silent failure”—where the agent doesn’t crash but performs the wrong action, like populating the wrong form field or scraping incorrect data—is insidious. It can lead to corrupted databases, flawed analytics, and poor business decisions based on unreliable information.
-
Erosion of Trust: For automation to be valuable, it must be trustworthy. If stakeholders cannot rely on an agent to complete its critical tasks—like processing customer orders or running end-to-end tests in a CI/CD pipeline—they will revert to manual processes. This undermines the very purpose of building the agent in the first place.
Introducing a Specialized Solution: Chrome DevTools for Agents
To overcome these challenges, we don’t necessarily need to build an entirely new suite of tools from scratch. Instead, we need to repurpose and combine the powerful, existing features within Chrome DevTools to create a debugging environment tailored for agents.
The conceptual shift is moving from debugging code execution to debugging the agent’s perception and decision-making process. We need to answer questions like:
What did the page look like* from the agent’s perspective at the exact moment of its decision?
What was the agent’s stated goal and what options* did it consider?
Why did it choose* one action over another?
By leveraging features like Performance recordings, Console logging, and DOM snapshots in a targeted way, we can transform DevTools from a code inspector into a flight recorder for our web agents. This allows us to capture a complete, replayable, and inspectable trace of the agent’s entire workflow—turning the opaque black box of its “mind” into a transparent glass box. The following sections will show you exactly how.
Setting Up Your Development Environment
Before we can debug the intricate dance between an AI model and a web browser, we need to build the dance floor. A proper development environment is non-negotiable; it’s the foundation for reproducible results and efficient troubleshooting. This setup ensures that your agent, your browser, and your debugging tools can all communicate effectively. Let’s get everything in place.
Prerequisites: Node.js, WebMCP, and Browser Setup
Our stack is lean but specific. You’ll need three core components to follow along:
- Node.js (LTS Version): Autonomous web agents often have their “brain”—the logic that makes decisions—running outside the browser in a separate process. Node.js is the perfect runtime for this. It allows us to execute our agent’s control script, manage dependencies via its package manager (npm), and orchestrate the browser automation. We recommend using the latest Long-Term Support (LTS) version (18.x or 20.x at the time of writing).
-
Action: Download and install Node.js for your operating system.
-
Verify: Open your terminal and run
node -v. You should see a version number likev20.11.0.
-
WebMCP (Web Model Control Protocol) Library: This isn’t a real protocol, but a conceptual placeholder for the specialized libraries that bridge the gap between a language model’s intent and a browser’s actions. In our examples, we’ll use a real-world library like
puppeteer-coreto act as our WebMCP implementation. This library allows our Node.js script to connect to and command a browser. We’ll install this in the next step. -
A Chromium-Based Browser: Since our focus is on Chrome DevTools, you’ll need a browser built on the Chromium engine.
-
Examples: Google Chrome, Microsoft Edge, Brave, or Vivaldi.
-
The Critical Piece: We won’t just be opening the browser normally. We will launch it with a special command-line flag:
--remote-debugging-port=9222. This flag is the secret sauce. It tells the browser to open a WebSocket server on port 9222, creating an open door for external tools—like our agent script and a separate DevTools instance—to connect and take control.
Step-by-Step Installation and Configuration
Let’s translate the prerequisites into a working project. Open your favorite terminal and follow these steps.
- Create Your Project Directory
First, create a dedicated folder for your agent and navigate into it.
mkdir my-web-agent

cd my-web-agent
- Initialize a Node.js Project
This command creates a package.json file, which will track our project’s dependencies and scripts. The -y flag accepts all the default prompts.
npm init -y
- Install Dependencies
Now, we’ll install puppeteer-core. This is a lightweight version of Puppeteer that doesn’t bundle its own version of Chromium, making it perfect for connecting to an existing browser instance that we’ll launch ourselves.
npm install puppeteer-core
- Create the Agent Control Script
Create a file named agent.js in your project folder and add the following code. This script will be the “brain” of our agent. It’s designed to connect to the browser we’ll launch in debug mode, navigate to a website, and perform a simple action.
// agent.js

const puppeteer = require('puppeteer-core');

// The endpoint provided by the browser when launched with --remote-debugging-port

const browserWSEndpoint = 'http://127.0.0.1:9222';

async function runAgentTask() {

console.log('Agent: Attempting to connect to browser...');

try {

// Connect to the already-running browser instance

const browser = await puppeteer.connect({

browserURL: browserWSEndpoint,

});

console.log('Agent: Successfully connected to browser.');

// Create a new page (tab) in the browser

const page = await browser.newPage();

await page.setViewport({ width: 1280, height: 800 });

// Navigate to a target page

const targetUrl = 'https://toscrape.com/';

console.log(`Agent: Navigating to ${targetUrl}...`);

await page.goto(targetUrl, { waitUntil: 'networkidle2' });

// Perform a simple task: get the page title

const pageTitle = await page.title();

console.log(`Agent: Task complete. Page title is "${pageTitle}".`);

// We don't close the browser here because we want to inspect it.

// The browser was launched externally and will remain open.

// We just disconnect our script from it.

await browser.disconnect();

console.log('Agent: Disconnected. The browser remains open for inspection.');

} catch (err) {

console.error('Agent: An error occurred!', err);

console.log('Is the browser running with --remote-debugging-port=9222?');

}

}

runAgentTask();
Launching Your First Agent Debugging Session
This is where everything comes together. This three-step launch sequence is the core workflow you’ll use every time you want to debug an agent.
Step 1: Launch the Browser in Debug Mode
First, you must close all currently running instances of Chrome. Then, open your terminal and run the command corresponding to your operating system. This command launches a new, isolated browser instance with the debugging port open.
The --user-data-dir flag is highly recommended. It forces the browser to start with a fresh, clean profile, preventing your personal extensions, cookies, and cache from interfering with the agent’s execution.
- macOS:
/Applications/Google\ Chrome.app/Contents/MacOS/Google\ Chrome --remote-debugging-port=9222 --user-data-dir=/tmp/chrome-dev-session
- Windows (Command Prompt):
"C:\Program Files\Google\Chrome\Application\chrome.exe" --remote-debugging-port=9222 --user-data-dir="C:\chrome-dev-session"
- Linux:
google-chrome --remote-debugging-port=9222 --user-data-dir=/tmp/chrome-dev-session
A new, clean Chrome window will appear. Leave it open and move to the next step.
Step 2: Run Your Agent Script
Go back to the terminal window in your project directory (my-web-agent) and run the script.
node agent.js
You will see two things happen simultaneously:
-
Your terminal will log the agent’s progress: “Attempting to connect…”, “Navigating…”, “Task complete…“.
-
The Chrome window you launched in Step 1 will spring to life, automatically navigating to
toscrape.com.
Step 3: Connect Chrome DevTools for Inspection
Now for the magic. Open a separate, regular Chrome window (your normal browsing window is fine).
-
Navigate to the special URL:
chrome://inspect -
Click on the “Configure…” button next to “Discover network targets” and ensure
localhost:9222is listed. -
Under the Remote Target section, you should see the
toscrape.compage that your agent is controlling. -
Click the
inspectlink below it.
A new Chrome DevTools window will pop up. This is not DevTools for your current browser; it is a remote control panel connected directly to the browser instance your agent is manipulating. You can now inspect the DOM, view console logs, analyze network traffic, and use all the powerful features of DevTools on the page that your agent is actively working on.
Congratulations! You have successfully set up a complete debugging environment for your autonomous web agent.
A Deep Dive into the Agent Debugging Panel
Once you’ve enabled agent debugging, a new “Agent” panel will appear in your Chrome DevTools. This panel is the command center for observing, pausing, and manipulating your autonomous agent’s lifecycle. It provides a level of introspection previously impossible, moving beyond simple console.log statements to a fully interactive debugging experience. Let’s break down its primary components.
Navigating the UI: Timeline, State, and Action Views
The Agent panel is typically organized into three interconnected panes that provide a holistic view of the agent’s operation. Understanding how they work together is the first step to mastering agent debugging.
- The Timeline View: This is the centerpiece of the panel. It presents a chronological, visual representation of the agent’s execution flow, similar to the Performance panel’s flame graph. Each action, observation, and thought process is rendered as a block on the timeline.
-
Actions (
click,type,scroll): These are often color-coded for quick identification. Clicking an action block in the timeline selects it, populating the other panes with its specific context. -
Observations (
read_dom,capture_screenshot): These blocks represent moments when the agent gathers information from the web page. -
Reasoning (
think): These are perhaps the most critical blocks. They represent the internal “thought process” or LLM call where the agent decides what to do next based on its current state and observations.
- The State View: Located to the side, this pane is a snapshot of the agent’s internal memory and configuration at the moment selected in the timeline. It’s analogous to the “Scope” pane in JavaScript debugging. Here you can inspect:
-
Current Objective: The high-level goal the agent is trying to achieve.
-
Working Memory: A structured view of recent observations, past actions, and accumulated data.
-
Variables: Key-value pairs the agent is tracking, such as extracted user data (
{ username: 'test_user' }) or flags ({ isLoggedIn: true }). -
Environment State: Information about the viewport, the current URL, and other environmental factors.
- The Action View: This pane provides a detailed breakdown of the action or event selected in the timeline. It typically shows:
-
Input Payload: The exact parameters used for the action (e.g., CSS selector for a click, text for a type command).
-
**Agent Rationale: A human-readable explanation of why the agent chose this specific action. This often includes a snippet from the LLM’s reasoning process.
-
Result: The outcome of the action, such as
SUCCESS,ERROR: Element not found, or the data returned from an observation.
These three views are synchronized. Clicking anywhere on the timeline instantly updates the State and Action views to reflect that precise moment in time, allowing you to travel through the agent’s execution history and understand the cause-and-effect relationship between its state, its decisions, and its actions.
Using Breakpoints to Pause and Inspect Execution
Real-time observation is useful, but true debugging requires the ability to pause execution and inspect the live environment. The Agent panel introduces a powerful new concept: agent-aware breakpoints. Unlike traditional code breakpoints that stop on a line of code, these breakpoints pause the agent based on its behavior.
You can set breakpoints from a dedicated “Breakpoints” sub-pane. Common types include:
-
Action Type Breakpoint: Pause execution whenever the agent is about to perform a specific type of action. For example, you can set it to break on every
clickorsubmit_formaction to verify the target and payload. -
State Change Breakpoint: This allows you to watch a variable in the agent’s State view. The agent will pause execution the moment that variable’s value changes, which is invaluable for tracking down when and why critical state modifications occur.
-
**LLM Prompt Breakpoint: A game-changer for debugging agent logic. This breakpoint pauses the agent just before it sends a prompt to the large language model. This gives you the unprecedented ability to inspect the exact context, observations, and instructions being fed to the LLM, helping you diagnose flawed reasoning at its source.
-
Error Breakpoint: The agent will automatically pause whenever an action results in an error (e.g., a selector doesn’t find an element, a navigation fails).
When a breakpoint is hit, the agent’s execution on the page freezes. The UI highlights the responsible action in the timeline, and you gain full control to inspect the environment.
Analyzing Agent State and Variable Payloads
With the agent paused at a breakpoint, the State and Action views become your primary tools for analysis. This is where you move from “what did the agent do?” to “why did the agent do it?“.
In the State View, you can expand objects and arrays to scrutinize the agent’s entire knowledge base at that moment.
-
Is the
shopping_cart_totalvariable being updated correctly after adding an item? -
Did the agent correctly parse the user’s address from a form into a structured JSON object in its working memory?
-
Is the history of past actions leading it down a repetitive, looping path?
In the Action View, you can analyze the payload for the pending action. For instance, if the agent is about to click a button, you can check the selector. You might discover it generated a brittle, non-specific selector like /html/body/div[3]/button[1] instead of a robust one like #checkout-button. This insight allows you to go back and refine the agent’s [Prompt Engineering for Reliable Autonomous Workspace Agents for Reliable Autonomous Workspace Agents](https://votuduc.com/prompt-engineering-for-reliable-autonomous-workspace-agents-p-20260319404106) or observation logic to generate better selectors.
Simulating and Modifying Agent Inputs in Real-Time
Interactive debugging is about more than just observation; it’s about intervention. The Agent panel provides powerful capabilities for modifying the agent’s state and inputs on the fly, allowing you to test hypotheses without restarting the entire task.
While paused at a breakpoint, you can:
-
Modify State Variables: Directly edit values in the State View. For example, if an agent is stuck because it thinks it’s logged out (
isLoggedIn: false), you can manually change this value totrueand resume execution to see if it proceeds down the correct path. -
Alter the Next Action: The Action View for a pending action is not read-only. You can modify the parameters of the upcoming action. If the agent chose the wrong button to click, you can edit the CSS selector to point to the correct one. If it’s about to type the wrong text into a field, you can correct it.
-
Inject New Observations: You can use the DevTools Console to manually alter the web page’s DOM, and then instruct the agent to re-run its observation step. This allows you to simulate different website responses or edge cases. For example, you could add an “Out of Stock” message to the page and see if the agent correctly identifies it and changes its strategy.
By combining these modification capabilities, you can guide a stuck agent, test its resilience to unexpected UI changes, and rapidly iterate on its logic without ever leaving the browser. This tight feedback loop is essential for building robust and reliable autonomous agents.
Practical Workflow: From Failing Script to Robust Agent
Theory is one thing, but debugging a real-world web agent that’s failing on a complex, dynamic site is where the rubber meets the road. Autonomous agents often fail due to timing issues, unexpected UI changes, or race conditions that are nearly impossible to diagnose from a simple stack trace. This is where a hands-on, interactive debugging workflow using Chrome DevTools becomes indispensable. Let’s walk through a repeatable process to turn a failing script into a resilient one.
Isolating Errors with Step-Through Execution
Your agent script executes in milliseconds, a speed far too great for human observation. A typical error like Error: No node found for selector: #submit-button tells you what failed, but it doesn’t tell you why. Was the button not rendered yet? Was it covered by a cookie banner? Was its ID different? To find out, you need to slow down time.
The most powerful tool for this is the debugger; statement. It’s a programmatic breakpoint that you can insert directly into your agent’s JavaScript code. When the browser’s JavaScript engine encounters this statement with DevTools open, it pauses execution right on that line.
Here’s the workflow:
-
Identify the Failure Zone: Locate the section of your agent’s code that is failing. For example, the function responsible for logging into a site.
-
Insert a Breakpoint: Place the
debugger;statement just before the line that throws the error.
// agent-login.js

async function login(page, credentials) {

await page.type('#username', credentials.user);

await page.type('#password', credentials.pass);

// The next line often fails. Let's find out why.

debugger;

await page.click('#submit-button');

}
- Launch in Headed Mode: Configure your automation library (like Puppeteer or Playwright) to run in “headed” mode with DevTools automatically opened.
-
Puppeteer:
puppeteer.launch({ headless: false, devtools: true }) -
Playwright: Use
await page.pause()which is Playwright’s specific equivalent, or launch withchromium.launch({ headless: false, devtools: true })and usedebugger;.
- Step Through the Code: When you run your script, the browser will launch, navigate, and then freeze, pulling focus to the Sources panel in DevTools. Execution is now paused at your
debugger;statement.
You now have full control over the script’s execution flow using the controls at the top of the debugger pane:
-
-
Resume (F8): Let the script run freely until it hits the next breakpoint.
-
Step Over (F10): Execute the current line and move to the next one. This is your most-used control. It executes a function without diving into its internal code.
-
Step Into (F11): If the current line is a function call, this will jump into that function’s source code.
-
Step Out (Shift+F11): If you’ve stepped into a function, this will complete its execution and return you to the calling line.
By repeatedly pressing F10 (Step Over), you can execute your agent’s logic one line at a time, watching the web page in the background. This allows you to see the exact state of the page at the moment of failure, transforming a mysterious error into an observable problem.
Analyzing DOM State and Network Logs at Failure Points
Once your script is paused at the critical moment, you can become a digital detective. The entire state of the web application is frozen in time, ready for your inspection.
DOM Analysis in the Elements Panel
With execution paused in the Sources panel, click over to the Elements panel. This view shows you the live, interactive DOM tree exactly as it existed when the script was halted.
Here’s what to look for:
-
Selector Validation: Does your target element actually exist? Use the search bar (
Ctrl+ForCmd+F) in the Elements panel to search for your selector (e.g.,#submit-button). If it yields 0 results, you’ve found your problem: the selector is wrong or the element hasn’t been rendered yet. -
Visibility and Interactivity: The element might exist in the DOM but not be “clickable.”
-
Styling: Check the Styles and Computed tabs. Is it hidden by
display: none;oropacity: 0;? Does it have a size of0pxby0px? -
Attributes: Is the
disabledattribute present on your target button? -
**Occlusion: Is another element covering your target? Often, a cookie consent banner, a chat widget, or a pop-up modal is the culprit. In the browser window, you can see what’s on top. Right-clicking where your element should be and selecting “Inspect” will reveal the obscuring element.
-
iFrames: Is your target element inside an
<iframe>? If so, your agent needs to switch its context to that frame before it can interact with elements inside it. The Elements panel makes this structure clear.
Network Analysis in the Network Panel
Flip over to the Network panel. It also preserves the state up to the breakpoint. This is crucial for diagnosing issues rooted in asynchronous data loading.
-
Pending Requests: Did your agent try to click a button before the
fetchorXHRcall that renders it has completed? Look for requests that are still “pending.” Your agent is likely too fast and needs to wait for a specific network response to finish. -
Failed API Calls: Look for any requests that have failed (a 4xx or 5xx status code, highlighted in red). A failed API call could mean the data needed to build the UI component your agent wants to interact with was never received, so the component was never rendered.
-
Race Conditions: By pausing, you can definitively see if the data has arrived and been processed. If a request has finished but the corresponding UI element isn’t on the page, the issue lies in the client-side rendering logic, not the network speed.
Sandboxing and Live-Editing Agent Code to Find a Fix
You’ve identified the problem. Now it’s time to find a solution, and you can do it without ever leaving DevTools. This interactive feedback loop is what makes this workflow so efficient.
Test Hypotheses in the Console
While paused, the Console is your playground. Its execution context is the current state of the page.
- Test New Selectors: If
document.querySelector('#submit-button')returnednull, inspect the element to find a more stable selector. Maybe it has adata-testidattribute. You can test your new idea directly in the console:
// Type this directly into the console to test it

document.querySelector('[data-testid="login-form-submit"]')
If it returns the correct element node, you’ve found your new selector.
- Simulate Agent Actions: You can run snippets of your agent’s logic directly. For example, to see if your newly found element is clickable, you can execute:
// Run this in the console to see if it works

document.querySelector('[data-testid="login-form-submit"]').click()
This gives you immediate feedback on whether your proposed fix will work.
Live-Edit and Resume in the Sources Panel
This is the final and most powerful step. You can edit your code live while it’s paused, apply the fix, and then resume execution to see if it works.
-
Navigate to your code in the Sources panel.
-
Edit the code directly in the panel. Change the failing selector from
'#submit-button'to the new, working one you discovered:'[data-testid="login-form-submit"]'. -
Save your changes (
Ctrl+SorCmd+S). Chrome will hot-swap the running code. -
Press F8 (Resume).
The script will now continue running with your modified code. If the agent successfully proceeds past the point where it was previously failing, you have validated your fix. You can now confidently copy that change back into your project’s source code in your IDE, knowing it works. This ability to iterate and test a fix in seconds, without restarting the entire process, is a game-changer for debugging complex agent interactions.
Advanced Techniques for Optimization
Once your autonomous agent is functional, the journey shifts from “does it work?” to “does it work well?“. Optimization isn’t just about speed; it’s about creating an agent that is efficient, resilient, and less prone to breaking. Chrome DevTools provides a suite of powerful instruments to move beyond basic debugging and into the realm of high-performance automation.
Profiling Execution to Identify Performance Bottlenecks
An agent that takes 30 seconds to complete a 5-second task is burning resources and time. The culprit could be anything from inefficient agent logic to a bloated target website. The Performance panel in DevTools is your primary tool for diagnosing these slowdowns.
How to Profile Your Agent’s Task:
-
Open DevTools and navigate to the Performance tab.
-
Click the “Record” button (or use the
Ctrl+E/Cmd+Eshortcut). -
Execute the task your agent is designed to perform. If you’re running a script (like Playwright or Puppeteer) in a non-headless mode, you can start the recording just before the key interactions begin.
-
Once the task is complete, stop the recording.
You’ll be presented with a detailed timeline of everything that happened on the page. Here’s what to look for:
-
Long Tasks: In the “Main” thread track, look for red-flagged tasks. These are JavaScript executions that block the main thread for more than 50 milliseconds, freezing the UI. If your agent is waiting for an element that becomes available only after a long task, you’ve found a major bottleneck. This might indicate complex, client-side rendering that your agent must patiently wait for.
-
Layout Thrashing: Look for a dense, repeating pattern of purple “Recalculate Style” and “Layout” events. This occurs when scripts (either the site’s or your agent’s) repeatedly write and then read from the DOM in a loop, forcing the browser to re-render the page over and over. For example, an agent that changes an element’s style and then immediately queries its
offsetHeightinside a loop can trigger this. -
Network Waterfall: The “Network” track within the performance profile shows every resource request. A long blue bar for the initial HTML document or a chain of dependent JavaScript files can delay when your agent can even begin its work.
Actionable Insight: The most significant optimization for web agents is often blocking non-essential network requests. If your agent only needs to interact with the HTML structure, it doesn’t need to wait for tracking scripts, ad pixels, CSS for a different media type, or large images.
Here’s how you might block images and CSS in Playwright, a strategy you can identify the need for using the Performance panel:
// Example: Blocking non-essential resources in Playwright

await page.route('**/*.{png,jpg,jpeg,css}', route => route.abort());

// Now, when you navigate, these resources won't be downloaded.

await page.goto('https://example.com');
By profiling first, you make informed decisions about what to block, dramatically speeding up the “page load” phase of your agent’s execution.
Refining Selectors for Long-Term Stability
A broken selector is the most common point of failure for any web agent. A minor CSS class name change or a restructured layout can render your carefully crafted XPath useless. The goal is to choose selectors that are tied to function, not presentation.
The Hierarchy of Good Selectors:
-
Test-Specific Attributes: The gold standard. Look for attributes like
data-testid,data-cy, ordata-qa. These are explicitly added for testing and automation and are the least likely to change. -
Accessibility Attributes: Attributes like
role,aria-label, andaria-labelledbyare tied to the user experience for assistive technologies. They describe the element’s function (e.g.,role="button") or purpose (e.g.,aria-label="Close dialog"). They are far more stable than stylistic classes. -
Semantic HTML: Use element types and attributes that convey meaning, like
form,input[name="username"], ora[href="/login"]. -
Content: As a last resort, you can select based on an element’s text content, but be wary of changes due to localization or copy updates.
Using DevTools to Find Stable Selectors:
-
Avoid “Copy Selector”: Right-clicking an element and choosing “Copy > Copy selector” is tempting, but it often generates brittle, path-dependent selectors like
div:nth-child(3) > button.btn-primary. Use this only as a starting point for analysis. -
Inspect the Accessibility Tree: In the Elements panel, select an element and then click the Accessibility tab in the right-hand pane. This shows you how the browser exposes the element to screen readers, often revealing a stable “Computed Name” or “Role” that you can use in your selectors.
-
Search the DOM: Use
Ctrl+F/Cmd+Fin the Elements panel to test your selectors in real-time. Aim for a selector that is unique and descriptive.
Example Transformation:
-
Brittle Selector:
#main-app > section:nth-child(2) > div.card.p-4.shadow-sm > button -
Stable Selector:
button[data-testid="submit-user-form"] -
Good Alternative:
button[aria-label="Submit User Information"]
Investing time in finding a robust selector will save you countless hours of maintenance down the line.
Strategies for Handling Dynamic Content and Asynchronous Events
Modern web applications are rarely static. Content loads in the background, modals fade into view, and buttons become enabled only after a network request completes. Using fixed delays (sleep(5)) is a fragile and inefficient anti-pattern. You must wait for specific conditions. DevTools is essential for discovering what those conditions are.
Tools for Deconstructing Asynchronous Behavior:
-
**Network Panel (Filter by Fetch/XHR): This is your most powerful tool. When you click a “Submit” button, what happens? Open the Network panel, filter by
Fetch/XHR, and perform the action. You will see the exact API endpoint that gets called. This tells you the true event you should be waiting for. Instead of waiting for a “Success!” message to appear on the screen, your agent should wait for the200 OKresponse from the/api/form-submitrequest. Most automation frameworks provide a mechanism for this (e.g.,page.waitForResponse()). -
Event Listener Breakpoints: In the Sources panel, the “Event Listener Breakpoints” section allows you to pause execution when specific events occur. For example, you can check
Mouse > click. Now, when you click a button on the page, the debugger will pause on the exact line of JavaScript that handles that click. By stepping through this code, you can uncover the entire chain of events: you might see it disable the button, make afetchcall, and then define a callback function to re-enable the button on success. This gives you a precise roadmap for what your agent needs to wait for. -
Animation Panel: If an element is present in the DOM but not yet clickable because of a CSS transition or animation (e.g., a modal fading in), the Animation panel (found under “More Tools”) can help. It visualizes all animations on the page, showing their duration and delay. This can help you understand why a
waitForSelectorcall succeeds, but a subsequent.click()fails. The solution is to wait for the element to be not just visible, but also “stable” or “enabled”—conditions most modern automation libraries support.
By using these tools, you replace guesswork with evidence. You stop writing agents that wait for an arbitrary amount of time and start writing intelligent agents that wait for specific, meaningful application state changes, making them faster and infinitely more reliable.
Conclusion and Next Steps
We’ve journeyed deep into the browser’s internals, repurposing the familiar Chrome DevTools from a web developer’s toolkit into an essential observatory for autonomous web agents. The principles of web debugging—inspection, interception, and iteration—don’t just apply; they are magnified in the context of agentic systems. By treating the browser as a transparent, stateful environment rather than a black box, we gain the critical visibility needed to build more reliable, efficient, and intelligent agents. Now, let’s crystallize these learnings and look toward the horizon.
Key Takeaways for Building Bulletproof Web Agents
Mastering agent development is synonymous with mastering the environment they operate in. Keep these core principles at the forefront of your debugging workflow:
-
The Console is Your Ground Truth: Beyond simple
console.log, use it as an interactive REPL to query the DOM, inspect agent-injected data (windowproperties), and manually trigger functions to test agent primitives in isolation. -
The Network Panel Tells the Full Story: Agents are chatty. They communicate with LLM backends, data APIs, and other services. Use the Network panel to scrutinize payloads, check for race conditions, and simulate network failures (
Offlinemode) to test your agent’s resilience. -
Performance Profiling isn’t Just for Page Load: An agent stuck in a perception-action loop is a performance bug. Use the Performance panel to record and analyze long tasks, identifying bottlenecks in your agent’s decision-making logic or DOM interaction patterns.
-
Overrides are Your Simulation Engine: Don’t wait for edge cases to appear in the wild. Use the Overrides tab in the Sources panel to mock API responses, inject specific DOM states, and create a controlled environment to test your agent’s adaptability and error handling.
-
Breakpoints on Everything: From event listeners to DOM mutations, setting strategic breakpoints allows you to freeze the world at the exact moment of failure, giving you a complete snapshot of the agent’s state and its perception of the web page.
The Future of Agent-Centric Development
The techniques we’ve covered are powerful, but they represent the early days of a new development paradigm. The tooling ecosystem is poised for a significant evolution, moving from adapting existing tools to creating purpose-built solutions for agent observability.
-
Agent-Specific DevTools: Imagine a new panel in DevTools dedicated to agents. It could visualize the agent’s internal monologue or ‘chain of thought,’ display its current objective, render its simplified ‘world model’ of the DOM, and track token consumption in real-time.
-
Integrated Debugging in IDEs: The boundary between your code editor and the browser will blur. We can expect IDE extensions that allow you to set ‘semantic breakpoints’ not on lines of code, but on agent intentions (e.g., ‘break when the agent decides to click a checkout button’).
-
Advanced Observability Platforms: The next generation of application performance monitoring (APM) tools will offer agent-specific dashboards. They’ll track metrics like task success rates, average actions per task, hallucination frequency, and automatically flag sessions where an agent becomes ‘stuck’ or deviates from its expected workflow.
-
Standardized State Protocols: A future where agents can emit a standardized stream of state and intent data. This would enable universal debugging tools to plug into any agent, regardless of its underlying architecture, providing a consistent and powerful debugging experience across the ecosystem.
Join the Conversation: Share Your Debugging Strategies
This field is moving at an incredible pace, and the most effective techniques are often discovered in the trenches. The collective knowledge of the community is our greatest asset. We encourage you to share your own experiences and insights.
What are your go-to strategies for debugging complex agent behavior? Have you written custom Puppeteer or Playwright scripts for observability? What’s the most counter-intuitive bug you’ve ever tracked down?
Share your thoughts, scripts, and war stories in our community forum or on X (formerly Twitter) with the hashtag #AgentDebugging. Let’s build the future of web automation together.


Stop Doing Manual Work. Scale with AI.
Want to turn these blog concepts into production-ready reality for your team?
Table Of Contents
Portfolios
Related Posts
Quick Links
Legal Stuff