

Automate Quarterly Investor Updates with Google Sheets and Gemini AI


The quarterly reporting grind steals precious time from founders trying to build the future. Learn how to turn this dreaded but necessary ritual into one of your most powerful strategic assets.

The Founder’s Dilemma: The Quarterly Reporting Grind
It’s a familiar scene in startups everywhere. The quarter is closing, the team is heads-down shipping product and closing deals, and then it looms on the calendar: “Investor Update Due.” What follows is the great data scramble—a multi-day, caffeine-fueled exercise in pulling metrics from a dozen different SaaS tools, wrangling spreadsheets, and trying to weave a coherent narrative from a mountain of raw numbers. It’s a dreaded but necessary ritual. You know you have to do it, but every moment spent compiling the past feels like a moment stolen from building the future. This is the quarterly reporting grind, and it’s one of the most persistent, time-consuming challenges for any founder.
Why consistent investor updates are non-negotiable
It’s tempting to view investor updates as a chore—a simple obligation to the people who wrote the checks. But that perspective misses the immense strategic value of a well-executed reporting cadence. Your investors are more than just a line on your cap table; they are your most powerful, and often underutilized, strategic asset.
Consistent, transparent updates achieve several critical goals:
-
Builds Trust and Confidence: Regular communication, especially when things aren’t perfect, demonstrates maturity and control. It shows you’re on top of the business, warts and all, which builds the long-term trust needed for follow-on funding and support during tough times.
-
Activates Your Network: An investor who understands your progress, challenges, and specific “asks” can become an extension of your team. They can make key customer intros, help source executive talent, or offer strategic advice precisely when you need it. A generic, infrequent update won’t arm them with the context they need to help.
-
Maintains Alignment: Your company evolves rapidly. A quarterly update ensures your investors’ understanding of the business keeps pace. It realigns everyone on the key priorities, pivots, and the “why” behind your recent decisions.
-
Creates a Forcing Function: The process of preparing an update forces you and your leadership team to step back from the daily firefight, analyze performance objectively, and synthesize your own strategy. It’s a valuable moment of structured reflection.
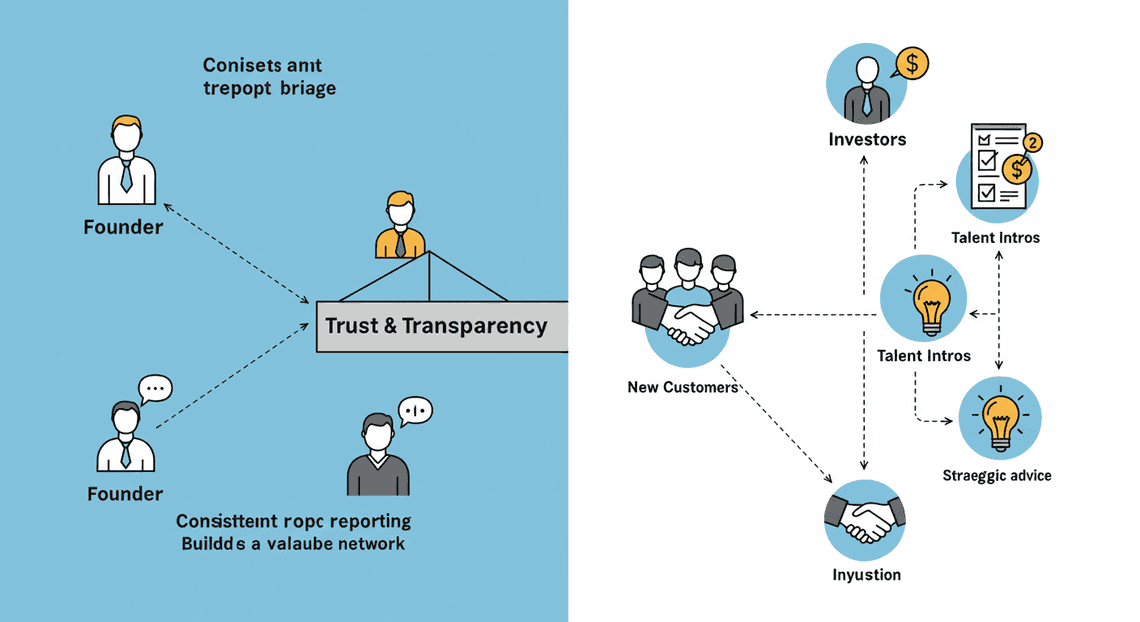
Skipping or rushing this process doesn’t just leave your investors in the dark; it leaves a massive amount of potential value on the table.
The hidden operational cost of manual reporting
The most obvious cost of manual reporting is time. A founder or senior team member can easily lose 10-20 hours every quarter just to the mechanics of the process. But the true cost is far greater and more insidious. It’s an operational drag that compounds over time.
Consider the hidden costs:
-
The Context-Switching Tax: Pulling a CEO or COO out of strategic work to manually copy-paste data from Stripe, Google Analytics, and your CRM is a massive productivity killer. The mental cost of switching from “growing the business” to “compiling a report” is immense.
-
Data Silos and Inconsistency: When data is pulled manually, it’s prone to error. One person might pull “New MRR” while another pulls “Net New MRR.” Metrics get defined differently, spreadsheets have broken formulas, and the final report can become a patchwork of questionable data points, eroding the very trust you’re trying to build.
-
The Opportunity Cost: What could you have done with those 20 hours? Closed a strategic partner? Interviewed a key hire? Coached a struggling team member? Every hour spent on low-leverage data wrangling is an hour not spent on high-leverage activities that actually move the needle.
-
Reactive vs. Proactive Analysis: The manual grind often means the report is finished just moments before it’s due. There’s no time for deep analysis or uncovering subtle trends. You’re simply reporting the past, not generating insights to shape the future.
This manual process isn’t scalable. As your company grows, the complexity of the data grows with it, and the reporting grind only gets worse.
Introducing an automated solution with [Automatically create new folders in Google Drive, generate templates in new folders, fill out text automatically in new files, and save info in [Automated Web Scraping with [Multilingual Text-to-Speech Tool with SocialSheet Streamline Your Social Media Posting 123](https://votuduc.com/Multilingual-Text-to-Speech-Tool-with-Google-Workspace-p809282)](https://votuduc.com/Automated-Web-Scraping-with-Google-Sheets-p292968)](https://workspace.google.com/marketplace/app/auto_create_folder_and_files/430076014869) and Gemini
What if you could reclaim those lost hours and transform your reporting process from a reactive chore into a proactive, strategic advantage? What if you could do it without buying another expensive, specialized SaaS tool, but by leveraging the platform you already live in every day?
This is where the power of an integrated, AI-enhanced workflow comes in. By combining the universal accessibility of Google Sheets with the advanced reasoning and language capabilities of Gemini AI, we can build a semi-automated engine for investor reporting.
Imagine a world where:
-
Your key metrics flow automatically into a master Google Sheet, creating a single source of truth.
-
You can use natural language to ask Gemini to analyze trends, summarize performance, and identify outliers directly within your spreadsheet.
-
Gemini helps you draft the narrative—the wins, the lessons, the asks—based on the quantitative data it’s already analyzed.
This isn’t about replacing the founder’s critical thinking. It’s about augmenting it. It’s about automating the 80% of the work that is pure mechanical drudgery—the data aggregation and initial synthesis—so you can focus 100% of your energy on the 20% that truly matters: the strategic narrative, the forward-looking plan, and the specific asks that will activate your investors. We’re moving from brute force to intelligent [Automated Job Creation in Real Time Jobber and Google Sheets Integration from Gmail](https://votuduc.com/Automated-Job-Creation-in-Jobber-from-Gmail-p115606), all within your existing, familiar toolkit.
Architecting Your Automated Reporting Engine
Before we write a single line of code, let’s architect our system. A robust architecture is the difference between a brittle script that breaks every quarter and a reliable, scalable engine that becomes an indispensable part of your operating rhythm. Think of this as the blueprint for our Automated Quote Generation and Delivery System for Jobber machine. We’re defining the purpose of each component and how they interact, ensuring a seamless flow of information from raw data to a polished, investor-ready PDF.
Our system is composed of four key components, each with a distinct role, all orchestrated by a central engine.
The Goal: A one-click investor letter PDF
Let’s start with the end in mind. The ultimate goal is to eliminate the frantic, last-minute scramble of compiling an investor update. We are building a system where, with a single click of a button (or a menu item in Google Sheets), we trigger a process that:
-
Pulls the latest, validated Key Performance Indicators (KPIs).
-
Gathers all the qualitative notes, wins, and challenges from the quarter.
-
Feeds this information to an AI to draft a coherent, insightful narrative.
-
Assembles the AI-generated text and key data visualizations into a professionally formatted document.
-
Saves the final output as a clean, shareable PDF in a designated Google Drive folder.
The “before” state is a multi-hour (or multi-day) process involving spreadsheets, copy-pasting, manual calculations, and endless wordsmithing. The “after” state is a 5-minute process: click, review, tweak, and send. This is the vision we’re building towards.
Component 1: Google Sheets as your single source of truth for KPIs
Every robust data system needs a Single Source of Truth (SSoT), and for our financial and operational metrics, Google Sheets is the perfect candidate. This isn’t just any spreadsheet; it’s a highly structured, machine-readable database.
Your KPI Sheet should be structured with Automated Work Order Processing for UPS in mind:
-
Raw Data Tabs: Separate tabs for raw data exports from your various platforms (Stripe for revenue, Google Analytics for traffic, your CRM for sales data, etc.). This keeps the source data clean and auditable.
-
A “Metrics” or “Dashboard” Tab: This is the core of our component. It’s a clean, consolidated tab that pulls from the raw data tabs to calculate and display your final, canonical KPIs for the quarter.
-
Structure is Key: Each metric (e.g., MRR, Gross Margin, CAC, LTV, Net Revenue Retention) should be in a consistent, predictable location.
-
Pro Tip: Use Named Ranges (e.g.,
current_q_mrr,previous_q_churn) for your key metric cells. This makes your Apps Script code far more resilient. Instead of referencingMetrics!B4, you’ll referencecurrent_q_mrr. If you later insert a row, your script won’t break. -
Chart-Ready Data: A small section on your Metrics tab can be formatted specifically to power the charts you want to include in your final report (e.g., a simple table of MRR over the last 6 quarters).
This sheet is the quantitative heart of your report. By keeping it clean, structured, and the undisputed SSoT, you ensure every report is built on a foundation of accurate data.
Component 2: Google Docs for capturing qualitative wins and narratives
Numbers tell half the story. The other half—the context, the “why” behind the data—lives in your team’s collective brain. Our goal is to create a low-friction system to capture this narrative throughout the quarter, not just in the last week. For this, we’ll use a simple, shared Google Doc.
This “Quarterly Log” Doc acts as a running journal for the business:
-
Simple Structure: The document can be organized with H2 headings for each major functional area (e.g.,
## Product,## Go-to-Market,## Team,## Challenges,## Key Asks). -
Continuous Capture: Encourage your team leads to drop in bullet points under the relevant headings whenever something significant happens. A major feature shipped? A key hire made? An unexpected competitor move? Drop it in the doc with a date.
-
The Anti-Recency Bias Tool: This practice combats the natural tendency to only remember what happened in the last few weeks. When it’s time to write the update, you have a rich, comprehensive log of the entire 13-week period, ensuring important early-quarter wins aren’t forgotten.
This document provides the raw, unstructured text that gives your report its color and depth. It’s the “why” that contextualizes the “what” from your Google Sheet.
The Engine: AI Powered Cover Letter Automation Engine to orchestrate data flow
If Google Sheets is the heart and Google Docs is the soul, Genesis Engine AI Powered Content to Video Production Pipeline is the central nervous system that connects everything. It’s the automation workhorse, living natively within the AC2F Streamline Your Google Drive Workflow ecosystem.
Apps Script will be responsible for executing the entire workflow:
-
Trigger: It will be initiated by a custom menu item we’ll create in our Google Sheet (e.g., “Generate Quarterly Report”).
-
Fetch Data: It will read the specific, named ranges from our KPI sheet.
-
Fetch Narrative: It will access the “Quarterly Log” Google Doc and extract all the text content.
-
Communicate with the Brain: It will package the quantitative data and qualitative text into a carefully crafted prompt and send it to the Gemini API.
-
Process Response: It will receive the AI-generated draft back from the API.
-
Assemble the Final Report: It will programmatically create a new Google Doc from a template, populate it with the AI-generated text, insert formatted tables, and generate charts using the Google Charts API.
-
Finalize Output: It will save the completed Google Doc and then export it as a PDF to a specified folder in Google Drive.
The beauty of Apps Script is its seamless, authenticated integration with the entire G Suite. There are no complex APIs to manage for accessing your own files; it just works.
The Brain: Gemini 1.5 Pro for intelligent content synthesis
This is where the magic happens. We’re not just templating; we’re synthesizing. Gemini 1.5 Pro, with its massive context window and advanced reasoning capabilities, will act as our AI-powered business analyst and copywriter.
Gemini’s role is not just to summarize, but to create a cohesive narrative:
-
Input: It will receive a prompt containing the structured KPIs from the Sheet and the unstructured notes from the Doc.
-
The Task: We will instruct it to act as a CEO writing to their investors. We’ll ask it to:
-
Analyze the KPIs and identify key trends, wins, and areas of concern.
Weave the qualitative notes from the Google Doc into the narrative to explain the reasons* behind the metric movements. For example, it can connect a note about a successful marketing campaign to a corresponding drop in Customer Acquisition Cost (CAC).
-
Adopt a specific tone of voice (e.g., “confident but transparent,” “data-driven and direct”).
-
Structure the output into standard investor update sections (e.g., “TL;DR,” “Highlights,” “KPI Deep Dive,” “Looking Ahead,” “Asks”).
-
Output: The result is a remarkably complete and coherent first draft of your investor letter. It’s not a simple mail merge; it’s a genuine synthesis of disparate information sources into a single, insightful story.
This component transforms the process from manual writing to strategic editing, saving you the 80% of time spent on the initial draft and allowing you to focus on high-level refinement and strategic messaging.
Step 1: Prepare Your Data Sources for Automation
Before we even think about prompting an AI, we need to lay the groundwork. The old adage “garbage in, garbage out” has never been more true than in automation. A well-structured data source is the difference between a seamless, one-click process and a frustrating cycle of debugging. Our automation will pull from two primary sources: a Google Sheet for our quantitative metrics and a Google Doc for our qualitative narrative. Let’s get them in order.
Structuring your Google Sheet with named ranges for key metrics
Your financial and operational data likely lives in a Google Sheet. While you could reference cells directly (like Dashboard!B4), this is brittle. If you insert a row or column, your reference breaks, and your automation fails. The robust solution is to use Named Ranges.
Named Ranges act like variables for your spreadsheet cells. You give a human-readable name to a specific cell or range of cells, and then you can refer to that name instead of its A1 notation. This makes your formulas—and more importantly, your API calls to Gemini—stable, readable, and easy to maintain.
How to Create a Named Range:
-
Open your Google Sheet and navigate to the cell containing the key metric you want to reference (e.g., your revenue for the most recent quarter).
-
Select the cell.
-
Go to the menu and click
Data > Named ranges. -
A sidebar will appear. In the input box, type a clear, descriptive name. Use a consistent naming convention, like
Metric_Quarter_Year. For example:Revenue_Q2_2024. -
Click “Done”.
Repeat this process for all the key metrics you want to include in your investor update.
Example Structure and Naming:
Imagine your summary tab looks like this:
| Metric | Q1 2024 | Q2 2024 |
| ------------------ | ------------ | ------------ |
| Revenue | $150,000 | $185,000 |
| New Customers | 45 | 62 |
| Cash on Hand | $500,000 | $420,000 |
| Monthly Burn (Avg) | $85,000 | $80,000 |
You would create the following named ranges:
-
Revenue_Q2_2024pointing to the cell with$185,000 -
NewCustomers_Q2_2024pointing to the cell with62 -
CashOnHand_Q2_2024pointing to the cell with$420,000 -
MonthlyBurn_Q2_2024pointing to the cell with$80,000
By using these names, our script can reliably fetch the correct data every quarter, regardless of how the sheet’s layout changes.
Creating a simple Google Doc template for your narrative input
While numbers tell part of the story, the narrative context—the wins, challenges, and strategic outlook—is what brings it to life. This is the human element we need to feed into our automation. The easiest way to manage this is with a simple, structured Google Doc that acts as a template.
The key is structure. We will use standard Markdown headings to clearly delineate sections. This allows our script to easily parse the document and feed the right context to Gemini.
Create a new Google Doc and structure it like this:
# Quarterly Update Narrative - [Quarter] [Year]

## Key Wins This Quarter

*   Launched the new feature X, which led to a 15% increase in user engagement.

*   Closed our first enterprise client, Acme Corp, for a $50k ACV contract.

*   Hired a new Senior Engineer who is already making a huge impact.

## Major Challenges Faced

*   Experienced unexpected downtime due to a vendor outage, impacting users for 2 hours. We have since implemented a new redundancy plan.

*   Sales cycle for mid-market customers is proving longer than anticipated. We are adjusting our strategy to provide more upfront value.

## Strategic Focus for Next Quarter

*   Launch our integration with Salesforce to unlock a new customer segment.

*   Hire two new Account Executives to build out the sales team.

*   Reduce customer acquisition cost (CAC) by 10% through targeted content marketing.

## Asks for Investors

*   Introductions to potential customers in the fintech space.

*   Feedback on our new product roadmap (link to deck).
Each quarter, you’ll simply duplicate this template, update the content, and save it with a consistent name (e.g., “Q2 2024 Investor Narrative”). The clean headings are crucial for our automation to correctly identify and extract each piece of the narrative.
Best practices for maintaining clean and accessible data
A successful automation system is built on a foundation of data discipline. Here are a few best practices to ensure your process remains smooth and reliable quarter after quarter.
-
Single Source of Truth (SSoT): Your core financial and operational metrics should live in one master Google Sheet. Avoid having fragmented data across multiple files. If you have raw data (like a transaction log), keep it on a separate tab and use formulas to pull summarized figures into a clean “Dashboard” or “Summary” tab. Your named ranges should always point to this summary tab.
-
Consistency is King: Stick to your naming conventions for both your named ranges and your narrative doc titles. For example, always use
Metric_Quarter_Year(e.g.,Revenue_Q2_2024,Revenue_Q3_2024). This predictability is what makes automation scalable. -
**Separate Inputs from Outputs: The Sheet and Doc we just prepared are inputs. The final investor update email or PDF is the output. Never mix them. Don’t write your narrative directly in the spreadsheet, and don’t put hardcoded numbers in your narrative doc. Let the automation assemble them.
-
Check Your Permissions: Ensure that the account you will use to run the automation script (your own Google account or a dedicated service account) has at least “Viewer” access to both the Google Sheet and the Google Doc. Without the right permissions, the script will fail to fetch the data.
Step 2: Building the Apps Script to Extract Data
With our data sources prepped, it’s time to roll up our sleeves and write the code that will act as the bridge between our Sheets, Docs, and the Gemini API. We’ll use [Architecting Multi Tenant AI Workflows in Building Modular Agentic Apps Script with Gemini Function Calling](https://votuduc.com/architecting-multi-tenant-ai-workflows-in-google-apps-script-p-20260321290501), a cloud-based JavaScript platform that lets you create applications that integrate with Automated Client Onboarding with Google Forms and Google Drive..
Setting up your script and required permissions (SheetsApp, DocsApp)
First, we need to access the script editor, which is conveniently built right into your Google Sheet.
-
Open your “Quarterly_KPI_Dashboard” Google Sheet.
-
Navigate to
Extensions>Apps Script. This will open a new tab with the Apps Script editor. -
Give your project a name. Click on “Untitled project” at the top left and rename it to something descriptive, like “Investor Update Automator”.
The editor will present you with a file named Code.gs containing an empty function. This is where we’ll write our logic.
At its core, Apps Script allows us to interact with other Google services through built-in libraries. For this project, we’ll need two crucial ones:
-
SpreadsheetApp: This service allows us to read, write, and manipulate data in Google Sheets. -
DocumentApp: This service lets us access and parse content from Google Docs.
The first time you run a function that uses these services, Google will trigger an authorization flow. It will ask for your permission to allow the script to manage your sheets and docs on your behalf. This is a standard and critical security step. You must grant these permissions for the script to function.
Let’s start by clearing the default function and setting up a placeholder for our main logic.
// Code.gs

// A best practice is to store IDs and other configuration details as constants.

const SPREADSHEET_ID = 'YOUR_SPREADSHEET_ID'; // Technically not needed if script is bound to the sheet, but good practice.

const DOC_ID = 'YOUR_GOOGLE_DOC_ID'; // Find this in the URL of your Google Doc.

function generateInvestorUpdate() {

// We will build our main logic here later.

// For now, it's a placeholder.

}
Replace YOUR_GOOGLE_DOC_ID with the actual ID from the URL of your “Quarterly Narrative” document. You can find it here: https://docs.google.com/document/d/THIS_IS_THE_ID/edit.
Function to fetch quantitative KPIs from your Sheet
Now, let’s write the function that will pull our structured quantitative data. This function will read the KPIs sheet, look for rows you’ve marked to be included, and format the data into a clean, machine-readable object.
We’ll design the function to read our pre-defined table structure: KPI Name (Column A), Value (Column B), and Include in Report (Column C).
/**

* Fetches quantitative KPI data from the 'KPIs' sheet.

* It only returns rows where the 'Include in Report' column is checked TRUE.

* @returns {Object} An object where keys are KPI names and values are their corresponding values.

*                   Example: { "MRR": "$52,300", "New Customers": 84, "Churn Rate": "2.1%" }

*/

function getQuantitativeData() {

try {

const sheet = SpreadsheetApp.getActiveSpreadsheet().getSheetByName('KPIs');

if (!sheet) {

throw new Error("Sheet 'KPIs' not found. Please check the sheet name.");

}

// Get all data from the sheet, skipping the header row (A1:C1).

// The range starts at row 2, column 1, and gets all rows down to the last row with content, and spans 3 columns.

const dataRange = sheet.getRange(2, 1, sheet.getLastRow() - 1, 3);

const values = dataRange.getValues(); // This returns a 2D array, e.g., [['MRR', 52300, true], ...]

const kpiData = {};

// Loop through each row of the data.

for (const row of values) {

const kpiName = row[0];

const kpiValue = row[1];

const includeInReport = row[2]; // This will be a boolean: true or false

// Only add the KPI to our object if the checkbox in column C is ticked (true) and it has a name.

if (includeInReport === true && kpiName) {

kpiData[kpiName] = kpiValue;

}

}

Logger.log('Successfully fetched KPI data:');

Logger.log(kpiData);

return kpiData;

} catch (error) {

Logger.log(`Error in getQuantitativeData: ${error.message}`);

// Return an empty object in case of an error to prevent downstream failures.

return {};

}

}
How to Test It:
-
Copy the code above into your
Code.gsfile. -
Ensure your
KPIssheet is populated with some data and at least one row has the “Include in Report” box checked. -
In the Apps Script editor, select
getQuantitativeDatafrom the function dropdown menu at the top. -
Click the “▶️ Run” button.
-
The first time, you’ll be prompted to “Review permissions”. Follow the steps to authorize the script.
-
After it runs, go to
View>Logs(or pressCtrl+Enter/Cmd+Enter). You should see the object containing your selected KPIs printed in the log.
Function to pull qualitative context from your Doc
Next, we need to extract the narrative—the “why”—from our Google Doc. This function will open the document, read its content, and parse it based on predefined headings (“Wins,” “Challenges,” “Key Asks”). This structured approach is far more reliable than just dumping the entire text.
/**

* Fetches qualitative context from a Google Doc with a specific ID.

* It parses the document by looking for specific heading texts and extracting the paragraphs that follow.

* @param {string} docId The ID of the Google Doc to parse.

* @returns {Object} An object containing the text for each section.

*                   Example: { "wins": "Landed two major enterprise clients...", "challenges": "Hiring for senior engineering roles...", "asks": "Introductions to potential Series A investors..." }

*/

function getQualitativeContext(docId) {

try {

if (!docId) {

throw new Error("Google Doc ID was not provided.");

}

const doc = DocumentApp.openById(docId);

const body = doc.getBody();

const elements = body.getNumChildren();

const context = {

wins: '',

challenges: '',

asks: ''

};

let currentSection = null;

// Iterate over each element (paragraph, list item, etc.) in the document body.

for (let i = 0; i < elements; i++) {

const element = body.getChild(i);

// Check if the element is a paragraph and a heading.

if (element.getType() == DocumentApp.ElementType.PARAGRAPH) {

const paragraph = element.asParagraph();

const text = paragraph.getText().trim().toLowerCase();

// Check if this paragraph text matches one of our target section headers.

if (text.startsWith('wins')) {

currentSection = 'wins';

continue; // Move to the next element without adding the header text itself

} else if (text.startsWith('challenges')) {

currentSection = 'challenges';

continue;

} else if (text.startsWith('key asks')) {

currentSection = 'asks';

continue;

}

}

// If we are inside a section, append the text of the current element.

if (currentSection && element.getType() == DocumentApp.ElementType.PARAGRAPH) {

// Add a space to separate paragraphs.

context[currentSection] += element.asParagraph().getText() + '\n';

}

}

// Clean up trailing newlines from each section.

for (const key in context) {

context[key] = context[key].trim();

}

Logger.log('Successfully fetched qualitative context:');

Logger.log(context);

return context;

} catch (error) {

Logger.log(`Error in getQualitativeContext: ${error.message}`);

return {}; // Return empty object on failure

}

}
How to Test It:
-
Add this function to your
Code.gsfile. -
Create a new function just for testing, like this:
function testQualitativeFetch() {

const docId = 'YOUR_GOOGLE_DOC_ID'; // Paste your Doc ID here again

getQualitativeContext(docId);

}
-
Make sure your Google Doc has headings like “Wins,” “Challenges,” and “Key Asks,” each followed by some text.
-
In the Apps Script editor, select
testQualitativeFetchfrom the dropdown and click “▶️ Run”. -
Check the logs (
View>Logs) to see the parsed object with your narrative content.
With these two functions, we now have a reliable way to programmatically extract all the raw data needed for our investor update. The next step is to send this structured data to the Gemini API for synthesis.
Step 3: Integrating Gemini for Intelligent Drafting
With our data neatly organized and accessible, it’s time for the main event: leveraging the Gemini API to transform raw numbers and bullet points into a polished, human-like investor update. This is where the automation transcends simple data reporting and enters the realm of intelligent content generation. We’ll use Google Apps Script as the bridge between our Google Sheet and the power of Google’s large language models.
Connecting to the Gemini API via Google Apps Script
Google Apps Script is the native, server-side scripting environment for the Automated Discount Code Management System ecosystem. It’s essentially JavaScript in the cloud, and it’s perfect for our needs because it has built-in services for interacting with Sheets and making external web requests.
First, you need a Gemini API key. You can generate one for free from Google AI Studio. Once you have your key, do not hardcode it directly into your script. This is a major security risk. Instead, we’ll use Apps Script’s PropertiesService to store it securely.
-
In your Apps Script editor, go to Project Settings (the gear icon ⚙️).
-
Scroll down to Script Properties and click Add script property.
-
Enter
GEMINI_API_KEYas the property name and paste your actual API key as the value. Click Save script properties.
Now, let’s write the function that will handle the communication with the Gemini API. This function will be our reusable workhorse for sending prompts and receiving generated text.
/**

* Calls the Gemini API with a given prompt and returns the generated text.

*

* @param {string} prompt The complete prompt to send to the Gemini API.

* @return {string} The text content from the Gemini API response.

*/

function callGeminiAPI(prompt) {

// Retrieve the API key securely from script properties

const API_KEY = PropertiesService.getScriptProperties().getProperty('GEMINI_API_KEY');

if (!API_KEY) {

throw new Error('GEMINI_API_KEY not found in script properties. Please set it in Project Settings.');

}

const API_URL = 'https://generativelanguage.googleapis.com/v1beta/models/gemini-1.5-flash-latest:generateContent?key=' + API_KEY;

// Structure the payload according to the Gemini API specification

const payload = {

"contents": [{

"parts": [{

"text": prompt

}]

}],

"generationConfig": {

"temperature": 0.6, // A little creativity, but still grounded

"topK": 1,

"topP": 1,

"maxOutputTokens": 8192,

}

};

const options = {

'method': 'post',

'contentType': 'application/json',

'payload': JSON.stringify(payload),

'muteHttpExceptions': true // Prevents script from stopping on HTTP errors

};

try {

const response = UrlFetchApp.fetch(API_URL, options);

const responseCode = response.getResponseCode();

const responseBody = response.getContentText();

if (responseCode === 200) {

const jsonResponse = JSON.parse(responseBody);

// Navigate the JSON structure to get the actual text

return jsonResponse.candidates[0].content.parts[0].text;

} else {

Logger.log(`Error: ${responseCode} - ${responseBody}`);

return `Error calling Gemini API: ${responseBody}`;

}

} catch (e) {

Logger.log(`Exception during API call: ${e.message}`);

return `Exception: ${e.message}`;

}

}
This script does a few key things:
-
It securely fetches the API key you stored.
-
It defines the correct API endpoint for the Gemini 1.5 Flash model (a great choice for its balance of speed and capability).
-
It constructs the JSON payload, wrapping our prompt in the required format. We’ve also included some
generationConfigparameters to control the output’s creativity. -
It uses Google’s
UrlFetchAppservice to make thePOSTrequest. -
It includes robust error handling and logging, so you can debug issues from the Apps Script execution logs.
Crafting a powerful prompt to structure the investor letter
The quality of your automated draft is 90% dependent on the quality of your prompt. A weak prompt like “Write an investor update” will yield generic, useless results. A strong, structured prompt acts as a detailed blueprint for the AI, ensuring the output is relevant, well-organized, and in the correct tone.
Our [Prompt Engineering for Reliable Autonomous Workspace Agents for Reliable Autonomous Workspace Agents](https://votuduc.com/prompt-engineering-for-reliable-autonomous-workspace-agents-p-20260319404106) strategy involves four key components:
-
Persona and Role: Tell the AI who it is. This sets the tone, vocabulary, and perspective.
-
Context: Provide background information about the company, the market, and the audience.
-
Structure and Formatting: Give explicit instructions on the desired sections, headings, and format (e.g., use Markdown).
-
Data Injection: Create placeholders where we will programmatically insert our quantitative and qualitative data from the spreadsheet.
Here is a powerful prompt template that incorporates all these elements. We’ll store this as a string in our Apps Script.
const PROMPT_TEMPLATE = `

You are the CEO of a B2B SaaS startup. Your tone is confident, transparent, and professional, but with a touch of a builder's passion. You are writing your quarterly update for a small group of knowledgeable seed-stage investors.

**Company Context:**

- Company Name: [Your Company Name]

- Sector: Cybersecurity Compliance Automation

- Current Stage: Seed

- Overall Goal: To become the leading compliance platform for mid-market tech companies.

**Instructions:**

- Write a comprehensive quarterly investor update based on the data provided below.

- The output MUST be in Markdown format.

- Keep the language clear and concise. Avoid excessive jargon.

- Start with a direct and engaging opening.

- End with a clear "Ask" for the investors.

**DATA FOR THE QUARTER**

**1. Quantitative Highlights (KPIs & Financials):**

{{kpi_data}}

**2. Qualitative Updates (Wins, Learnings, and Blockers):**

{{qualitative_data}}

**LETTER STRUCTURE**

**Subject: Q[Quarter Number] [Year] Investor Update: [A compelling 2-5 word summary of the quarter]**

Hi Team,

**1. TL;DR / Executive Summary**

- Start with a 2-3 sentence paragraph summarizing the quarter's performance and key theme. Was it a quarter of growth, consolidation, product breakthroughs, or resilience?

**2. Key Metrics & Financials**

- Present the key metrics from the data provided.

- For each key metric, briefly explain the "why" behind the number. For example, if MRR grew, mention the key driver (e.g., "driven by three new enterprise logos"). If churn increased, be transparent about the cause.

**3. Product & Team Updates**

- Based on the qualitative wins, write a narrative about our progress.

- Mention key feature launches, important hires, or significant product milestones.

**4. Challenges & Roadblocks**

- Based on the qualitative blockers, transparently discuss the challenges we faced this quarter.

- Frame them not as excuses, but as problems we are actively solving. Mention our proposed solutions.

**5. The Ask**

- Clearly state what we need from our investors. This could be introductions, advice on a specific problem, or feedback on our strategy. Be specific.

Best,

[Your Name]

CEO, [Your Company Name]

`;
Notice the {{kpi_data}} and {{qualitative_data}} placeholders. This is where our script will inject the data pulled directly from our Google Sheet.
Combining quantitative and qualitative data into a single API call
Now, we’ll write the main function that ties everything together. This function will read data from our “Data” and “Inputs” sheets, format it, inject it into our prompt template, and then call the callGeminiAPI function we wrote earlier.
/**

* Main function to generate the investor update.

* Reads data from the sheet, formats it, builds the prompt,

* calls the Gemini API, and writes the output to the 'Draft' sheet.

*/

function generateInvestorUpdate() {

const ss = SpreadsheetApp.getActiveSpreadsheet();

const dataSheet = ss.getSheetByName('Data');

const inputsSheet = ss.getSheetByName('Inputs');

const draftSheet = ss.getSheetByName('Draft');

// 1. Read and format quantitative data

const kpiRange = dataSheet.getRange('A4:C10').getValues(); // Adjust range as needed

let kpi_data_string = "Key Performance Indicators:\n";

kpiRange.forEach(row => {

if (row[0]) { // Ensure the row is not empty

kpi_data_string += `- ${row[0]}: ${row[1]} (${row[2]} QoQ)\n`;

}

});

const financialRange = dataSheet.getRange('E4:G7').getValues(); // Adjust range as needed

kpi_data_string += "\nFinancial Summary:\n";

financialRange.forEach(row => {

if (row[0]) {

kpi_data_string += `- ${row[0]}: $${row[1].toFixed(2)} (${row[2]})\n`;

}

});

// 2. Read and format qualitative data

const wins = inputsSheet.getRange('B3:B7').getValues().filter(String).join('\n- ');

const challenges = inputsSheet.getRange('B10:B14').getValues().filter(String).join('\n- ');

const ask = inputsSheet.getRange('B17:B19').getValues().filter(String).join('\n- ');

let qualitative_data_string = `**Key Wins This Quarter:**\n- ${wins}\n\n`;

qualitative_data_string += `**Challenges & Blockers:**\n- ${challenges}\n\n`;

qualitative_data_string += `**Our Ask for You:**\n- ${ask}`;

// 3. Build the final prompt by injecting data into the template

let finalPrompt = PROMPT_TEMPLATE.replace('{{kpi_data}}', kpi_data_string);

finalPrompt = finalPrompt.replace('{{qualitative_data}}', qualitative_data_string);

// Add other details from the inputs sheet

const quarter = inputsSheet.getRange('B21').getValue();

const year = inputsSheet.getRange('B22').getValue();

finalPrompt = finalPrompt.replace('[Quarter Number]', quarter).replace('[Year]', year);

Logger.log("--- FINAL PROMPT SENT TO API ---");

Logger.log(finalPrompt);

// 4. Call the API and write the output

draftSheet.getRange('B3').setValue('Generating draft... Please wait.');

const generatedDraft = callGeminiAPI(finalPrompt);

draftSheet.getRange('B3').setValue(generatedDraft);

SpreadsheetApp.flush(); // Ensures the changes are written immediately

}
This function is the engine of our automation. It systematically gathers all the disparate pieces of information, assembles them into a single, highly-contextualized prompt, and sends one efficient API call. The result is a coherent and structured draft that understands the relationship between the numbers and the narrative, all written to a designated cell in our ‘Draft’ sheet, ready for your final review.
Step 4: Generating and Finalizing the Report
With the heavy lifting of data preparation and API communication behind us, we’ve arrived at the most satisfying part of the process: transforming Gemini’s raw text response into a polished, professional document. This step is where our script graduates from a data processor to a genuine report generator. We’ll parse the AI’s output, programmatically create a Google Doc, and finally, convert it into a shareable PDF, ready for distribution.
Processing the Gemini API response
The Gemini API doesn’t just send back plain text; it returns a structured JSON object. Our first task is to carefully unpack this object to extract the generated investor letter. A successful response from the gemini-pro model typically looks something like this:
{

"candidates": [

{

"content": {

"parts": [

{

"text": "Dear Investors,\n\nWe are pleased to report on the strong performance of Q3 2024..."

}

],

"role": "model"

},

// ... other metadata

}

],

// ... other metadata

}
Our prize is buried inside that text field. To get to it, we need to parse the JSON string and navigate the structure. Google Apps Script makes this trivial with its built-in JSON.parse() method.
Here’s how you can reliably extract the content within your generateUpdateLetter function, right after the UrlFetchApp.fetch() call:
// Previous code... fetching the response from Gemini API

var response = UrlFetchApp.fetch(url, options);

var responseText = response.getContentText();

// 1. Parse the JSON response from the API

var jsonResponse = JSON.parse(responseText);

// 2. Safely navigate the JSON to find the generated text

// We add checks to prevent errors if the API response structure is unexpected

var generatedText = "";

if (jsonResponse.candidates && jsonResponse.candidates.length > 0) {

var candidate = jsonResponse.candidates[0];

if (candidate.content && candidate.content.parts && candidate.content.parts.length > 0) {

generatedText = candidate.content.parts[0].text;

}

}

// 3. Handle cases where no text was returned

if (!generatedText) {

Logger.log("Error: Could not extract text from Gemini response.");

SpreadsheetApp.getUi().alert("Failed to generate report. Check the logs for details.");

return; // Stop execution if we have no content

}

Logger.log("Successfully extracted text from Gemini.");

// Now, 'generatedText' holds our full investor letter.
By adding checks at each level (jsonResponse.candidates, candidate.content, etc.), we make our script more robust. If Gemini returns an error or an unexpected format, our script will fail gracefully instead of crashing.
Creating a new Google Doc with the generated letter
Now that we have the letter’s content in the generatedText variable, we can use the DocumentApp service to create a new Google Doc. This service is our gateway to programmatically controlling Google Docs, from creation to complex editing.
The process is straightforward: create a new document, get a reference to its body, and then insert our text. We can even add a title and apply basic formatting to give it a professional structure right from the start.
Let’s add the following code to our script:
// ... continuing from the previous block

// Define a dynamic document title using the current date

var date = new Date();

var formattedDate = (date.getMonth() + 1) + '-' + date.getDate() + '-' + date.getFullYear();

var docTitle = `Quarterly Investor Update - ${formattedDate}`;

// 1. Create a new Google Doc

var doc = DocumentApp.create(docTitle);

Logger.log(`Created new Google Doc with ID: ${doc.getId()}`);

// 2. Get the body of the document to add content

var body = doc.getBody();

// 3. Add a main heading to the document

// This is better than including "Dear Investors" in the prompt, as it gives us more control

body.appendParagraph("Quarterly Investor Update").setHeading(DocumentApp.Attribute.HEADING1);

// 4. Add the AI-generated letter content

// We'll split the text by newlines to preserve paragraph breaks

var paragraphs = generatedText.split('\n');

paragraphs.forEach(function(paragraph) {

if (paragraph.trim() !== "") { // Avoid adding empty paragraphs

body.appendParagraph(paragraph);

}

});

// 5. Save and close the document to ensure all changes are written

doc.saveAndClose();

var docId = doc.getId(); // We need this ID for the next step!
This snippet does more than just dump text. It creates a well-named file, adds a clean H1 heading, and intelligently handles paragraph breaks from the AI’s response. The final doc.getId() is crucial, as it provides the unique identifier we’ll use to find this exact file in Google Drive for our final conversion step.
Using DriveApp to convert the final Doc into a professional PDF
A Google Doc is great for editing, but a PDF is the standard for professional distribution. It’s non-editable, maintains formatting across all devices, and looks clean. The DriveApp service in Apps Script allows us to perform file-level operations, including the powerful ability to convert file types.
The final piece of our script will locate the Google Doc we just created, request its content as a PDF, and then save that PDF to a specific folder in your Google Drive.
First, create a folder in your Google Drive named “Automated Investor Reports” (or similar) and get its ID from the URL (it’s the last part of the URL when you’re in the folder).
Now, add this final block of code to your function:
// ... continuing from creating the Google Doc

// The ID of the folder where you want to save the final PDFs

var FOLDER_ID = "YOUR_FOLDER_ID_HERE";

try {

// 1. Get the Google Doc file using its ID

var docFile = DriveApp.getFileById(docId);

// 2. Get the folder where the PDF will be saved

var pdfFolder = DriveApp.getFolderById(FOLDER_ID);

// 3. Get the content of the Doc as a PDF "blob"

var pdfBlob = docFile.getAs('application/pdf');

// 4. Create the new PDF file in the specified folder

var pdfFile = pdfFolder.createFile(pdfBlob);

pdfFile.setName(docFile.getName() + ".pdf"); // Name it the same as the Doc, but with .pdf

Logger.log(`Successfully created PDF: ${pdfFile.getName()} in folder: ${pdfFolder.getName()}`);

// 5. (Optional but recommended) Clean up by trashing the temporary Google Doc

docFile.setTrashed(true);

SpreadsheetApp.getUi().alert(`Success! Report generated and saved as a PDF. Check your '${pdfFolder.getName()}' folder.`);

} catch (e) {

Logger.log(`Error during PDF conversion: ${e.toString()}`);

SpreadsheetApp.getUi().alert("Error during PDF conversion. Check logs.");

}
Breaking it down:
-
We use
DriveApp.getFileById()to grab the temporary Google Doc. -
getAs('application/pdf')is the magic method that handles the entire conversion, returning the file’s content as a binary “blob” in PDF format. -
folder.createFile(blob)creates a new physical file in Google Drive from that blob. -
Finally, we perform a bit of housekeeping by moving the now-redundant Google Doc to the trash with
setTrashed(true). This keeps our Drive clean, leaving only the final PDF artifact.
And that’s it! With this final step complete, a single click of a button in your Google Sheet now orchestrates a complete workflow: reading data, querying a powerful AI, and producing a polished, professional PDF report in a designated folder.
Conclusion: From Hours to Minutes
We’ve journeyed from the familiar grid of Google Sheets to the cutting-edge capabilities of Gemini AI, building a powerful automation pipeline that transforms a dreaded quarterly task into a streamlined, repeatable process. The solution isn’t just about saving time; it’s about fundamentally changing how you approach stakeholder communication, freeing you to focus on the work that drives the numbers, not just report on them.
Recap: The benefits of an automated reporting system
Moving away from manual copy-pasting and narrative crafting isn’t a minor optimization—it’s a strategic upgrade. The system we’ve outlined provides tangible benefits that compound over time:
-
Radical Time Savings: The most immediate ROI is reclaiming your time. What once took hours, or even days, of painstaking data compilation and writing can now be accomplished in minutes. This frees up founder and leadership bandwidth for high-value activities like strategy, product development, and sales.
-
Unwavering Consistency and Accuracy: Automation eliminates the risk of human error. By pulling directly from a single source of truth (your Google Sheet) and using a consistent model for analysis, you ensure every report is accurate, professional, and uniform in its structure and tone.
-
Deeper, Data-Driven Insights: Gemini does more than just populate a template. It acts as an AI-powered analyst, identifying trends, highlighting key performance indicators, and helping you craft a compelling narrative around the data. This leads to richer, more insightful updates that build investor confidence.
-
Enhanced Investor Relations: An efficient reporting process makes it easier to maintain a regular, professional cadence of communication. Timely, well-structured updates demonstrate operational excellence and keep your investors engaged and informed, fostering a stronger, more transparent relationship.
Beyond reporting: The potential of AI in startup operations
The investor update pipeline is just the beginning. The core principle—connecting structured data sources to a powerful Large Language Model—is a versatile framework that can be applied across your entire organization to create operational leverage. Think of this project as your gateway to broader AI integration.
Consider the possibilities:
-
Sales & Marketing: Automate the generation of personalized outreach emails based on CRM data, create A/B test variations for ad copy, or summarize lead interaction histories for your sales team before a call.
-
Customer Support: Funnel support tickets and user feedback into a Sheet, then use Gemini to categorize issues, identify emerging trends, and draft initial knowledge base articles to address common problems.
-
Product Development: Aggregate user feedback from disparate sources (App Store reviews, Intercom, surveys) to generate concise summaries for product managers, helping them prioritize features and bug fixes based on real-world data.
-
Internal Operations: Automatically generate weekly project status summaries from your task manager, create minutes and action items from meeting transcripts, or even assist developers in generating boilerplate code and documentation.
Each of these applications follows the same pattern: leveraging AI to turn raw data into actionable intelligence and automated output, allowing your team to scale its impact without scaling its headcount.
Ready to scale your architecture? Book a GDE discovery call
The Google Sheets and Apps Script solution is a fantastic, high-leverage starting point. But as your startup grows, so will your data complexity, security requirements, and the need for more robust, scalable infrastructure. You might need to move from Sheets to BigQuery, trigger workflows from external events, or fine-tune models on your proprietary data.
If you’re thinking about what’s next, let’s talk. This article was written by a Google Developer Expert (GDE) in Google Cloud and Workspace, specializing in helping companies like yours build scalable, AI-powered solutions.
In a free, no-obligation discovery call, we can discuss your specific challenges and architect a path forward, whether that involves:
-
Migrating your data pipeline to a serverless architecture with Cloud Functions and BigQuery.
-
Implementing more advanced AI workflows using [Building Self Correcting Agentic Workflows with Building Self-Correcting Agentic Workflows with Vertex AI](https://votuduc.com/building-self-correcting-agentic-workflows-with-vertex-ai-p-20260321542526).
-
Ensuring your systems are secure, compliant, and built for scale.
Don’t let technical hurdles slow your growth. Let’s build the infrastructure that will power your next stage of success.
[Book Your Free GDE Discovery Call Today]


Stop Doing Manual Work. Scale with AI.
Want to turn these blog concepts into production-ready reality for your team?
Table Of Contents
Portfolios
Related Posts
Quick Links
Legal Stuff