

Unlock Real Time OEE Analytics Directly in Google Chat


Modern factories are drowning in data but starving for insight. Discover the critical “data lag” between event and action that is silently eroding your efficiency and profitability.

The Challenge: The Data Lag in Modern Manufacturing
The modern factory floor is a torrent of data. Sensors on every machine, logs from every process, and outputs from every line generate terabytes of information, promising a new era of data-driven optimization. Yet, for many organizations, this promise remains just out of reach. The critical bottleneck isn’t the generation of data, but the time it takes for that data to be transformed into actionable insight in the hands of the people who need it most. This delay—the gap between an event occurring and an informed decision being made—is the data lag, and it silently erodes efficiency, quality, and profitability.
Why Traditional Dashboards Fall Short for Immediate Decisions
Business Intelligence (BI) dashboards have become the default window into operational performance. They are invaluable for weekly reviews, trend analysis, and high-level strategic planning. However, when it comes to the second-by-second reality of the factory floor, they reveal critical limitations.
-
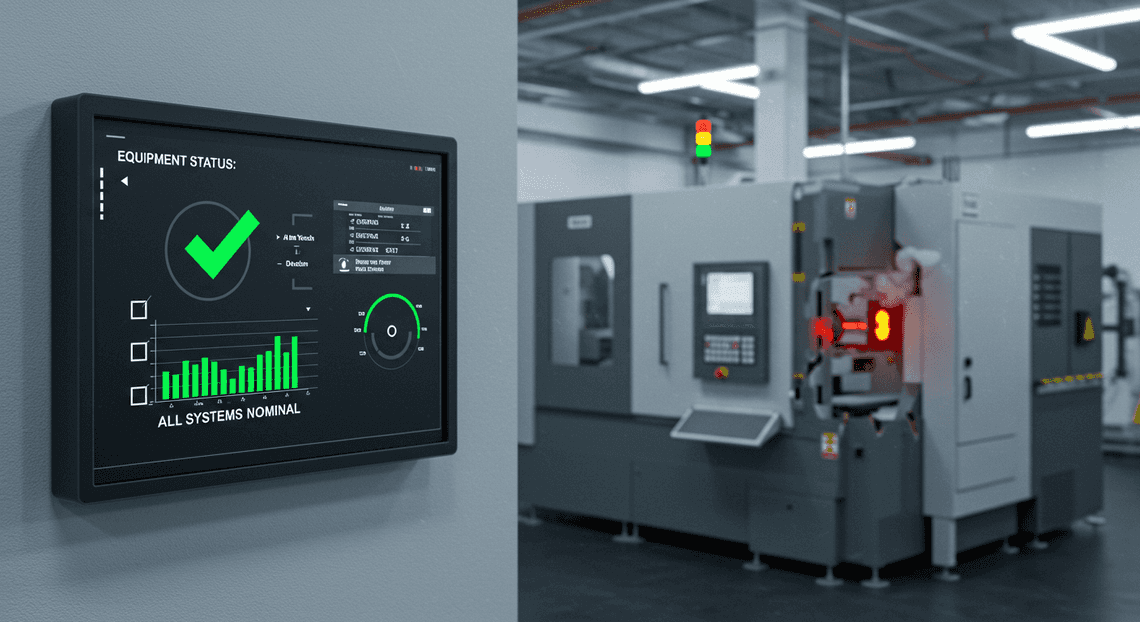
Passive by Design: Dashboards are a destination, not a notification system. A line supervisor or maintenance engineer must consciously stop their work, navigate to a specific URL or application, and actively look for problems. The onus is on the human to pull information, meaning issues are often discovered long after they begin.
-
Friction and Context Switching: In a high-pressure environment, every extra click is a barrier. Moving from the physical workspace to a digital dashboard, filtering for the right machine, and interpreting complex charts creates a significant cognitive load. This friction discourages the kind of frequent, in-the-moment checks that prevent small issues from becoming major shutdowns.
-
Delayed “Real-Time”: The term “real-time dashboard” is often a misnomer. Data pipelines, database queries, and visualization rendering introduce latency. A dashboard that refreshes every five minutes is blind to a machine that just went down or a quality parameter that just went out of spec. On a high-speed production line, five minutes can be the difference between a minor adjustment and a mountain of scrap.
The High Cost of Delayed Visibility into Equipment Effectiveness
This data lag isn’t just a technical inconvenience; it has a direct and substantial impact on the bottom line, often manifesting as a slow bleed on Overall Equipment Effectiveness (OEE).
Consider a common scenario: a machine’s performance subtly degrades, running at 90% of its target speed. On a traditional dashboard, this minor dip might not trigger a red alert or could be lost in the noise of aggregated data. If it takes an hour for a supervisor to notice during a routine check, the company has already lost 6 minutes of production capacity from that single machine.
Now, multiply that effect across dozens of assets and multiple shifts. The costs compound rapidly:
-
Lost Availability: Minor stops and unexpected downtime go unaddressed for longer, directly reducing productive time.
-
Reduced Performance: Machines run at suboptimal speeds, creating an invisible drag on throughput that only becomes apparent at the end of a shift or day.
-
Poor Quality: Deviations from process parameters can lead to defects and rework. The longer the delay in detection, the larger the batch of compromised product.
Delayed visibility forces teams into a reactive posture, constantly fighting fires that could have been prevented with timely information. The cost is measured in lost units, wasted materials, and inefficient allocation of skilled labor.
Introducing Conversational Analytics: A Paradigm Shift for Operations
To close the data lag, we need to fundamentally change how we interact with operational data. We must move from a model where people go to the data to one where data comes to the people, fitting seamlessly into their existing workflows. This is the promise of Conversational Analytics.
Instead of relying on passive dashboards, Conversational Analytics brings insights directly into the collaboration tools teams use every day, like Google Chat. It represents a paradigm shift in three key ways:
-
From Pull to Push & Query: Rather than manually checking a dashboard, critical alerts (e.g., “Line 2 OEE dropped below 75%”) are automatically pushed to a relevant group chat. Furthermore, anyone can query the system in plain language (e.g., “@OEEBot what is the current status of the CNC machine?”) and get an immediate response.
-
Data in Context: The information doesn’t live in an isolated tab. It appears right where the team is already communicating, allowing for immediate discussion, diagnosis, and delegation of tasks. The data becomes the starting point for a conversation, not the end point of an investigation.
-
Action over Analysis: The goal is to shrink the time from insight to action. By delivering a specific, relevant data point to the right people in the right place, Conversational Analytics bypasses the friction of traditional BI tools and empowers teams to solve problems in true real-time.
A Strategic Blueprint for Instant OEE Insights
To move from concept to reality, we need a robust and scalable architecture. The magic of this solution isn’t in a single monolithic application, but in the elegant orchestration of several powerful, serverless Google Cloud services. Each component is chosen for a specific purpose, working in concert to deliver insights from the factory floor to your chat window in seconds. Let’s dissect this blueprint.
Core Components: Google Chat, BigQuery, and Gemini Pro
At the heart of our system are three foundational pillars of the Google Cloud ecosystem. Understanding their individual roles is key to grasping the power of their combination.
-
Google Chat as the Interactive Frontend: Think of Google Chat as more than just a messaging platform; it’s an extensible application surface. For our purposes, it serves as the command-line interface (CLI) for the entire manufacturing floor. By leveraging slash commands (
/oee) and interactive cards, we provide a zero-friction user experience. Stakeholders don’t need to open a separate dashboard or learn a new tool. They can request critical OEE data directly within the conversational flow of their daily work, making data access immediate, contextual, and collaborative. -
BigQuery as the Scalable Data Warehouse: BigQuery is the single source of truth for our OEE data. This fully managed, petabyte-scale data warehouse is where raw data from industrial IoT sensors, SCADA systems, and Manufacturing Execution Systems (MES) is ingested, stored, and structured. Its powerful SQL engine and serverless architecture mean we can execute complex analytical queries across massive datasets with incredible speed without managing any infrastructure. For our solution, BigQuery acts as the high-performance data engine, reliably serving up precise OEE metrics (Availability, Performance, Quality) on demand.
-
Gemini Pro as the AI-Powered Analyst: Raw data is useful, but interpreted insight is powerful. This is where Gemini Pro, Google’s multimodal AI model, comes into play. After BigQuery fetches the requested OEE numbers, the data is passed to Gemini Pro. Its role is twofold: first, to analyze the structured data, and second, to synthesize it into a concise, human-readable narrative. Instead of just returning a table of numbers, Gemini Pro generates a summary that highlights key performance indicators, identifies potential issues (e.g., “Performance is below target due to frequent micro-stoppages”), and presents the information in a clear, conversational tone suitable for a chat environment. It transforms a data pull into a decision-support tool.
The Architecture: How a Slash Command Triggers Real-Time Data Pulls
The entire process, from a user typing a command to receiving a formatted report, is a seamless, event-driven workflow that typically completes in under five seconds. Here’s a step-by-step breakdown of the data flow:
-
User Invocation: A user in a designated Google Chat space types a slash command, for example:
/oee line-5 last-shift. -
Webhook Event: Google Chat immediately recognizes the slash command and sends a secure HTTPS request (a webhook) containing a JSON payload to a predefined endpoint. This payload includes the command name, parameters (
line-5,last-shift), user information, and conversation context. -
Server Ingestion: Our central server receives and validates this incoming webhook request from Google Chat.
-
Query Construction: The server’s business logic parses the parameters from the JSON payload. It then dynamically constructs a precise SQL query tailored to fetch the requested OEE data from the appropriate BigQuery table.
-
BigQuery Execution: The server, using a secure service account with the necessary permissions, executes the SQL query against the BigQuery API. BigQuery processes the query across potentially terabytes of data and returns a structured result set, typically in JSON format.
-
AI-Powered Synthesis: The server takes the structured data returned by BigQuery and packages it into a carefully engineered prompt for the Gemini Pro API. The prompt instructs the model to analyze the data and generate a summary of the OEE performance for “Line 5” during the “last shift.”
-
Card Formatting: Gemini Pro returns a block of text. The server then takes this AI-generated summary and the key numerical data and formats it all into a Google Chat Card V2 JSON object. This allows for rich formatting with headers, sections, key-value widgets, and even buttons for follow-up actions.
-
Response Delivery: Finally, the server sends this Card V2 JSON object back to the Google Chat API as the response to the initial webhook event. The richly formatted card instantly appears in the chat space for the user and other members to see.
The Role of the Workspace MCP Server as the Central Hub
The linchpin holding this entire architecture together is what we call the Workspace Master Control Program (MCP) Server. This isn’t a massive, physical server but rather a lightweight, scalable, and often serverless application—ideally deployed as a Google Cloud Function or a Cloud Run service. It acts as the central orchestrator and intelligent router for the entire system.
Its primary responsibilities include:
-
Webhook Endpoint: It provides the public, secure HTTPS URL that Google Chat sends
INTERACTIONevents to. -
Authentication & Authorization: It is responsible for verifying that incoming requests are genuinely from Google Chat. It also manages its own identity via a service account to securely authenticate its outbound API calls to BigQuery and the [Building Self Correcting Agentic Workflows with Building Self-Correcting Agentic Workflows with Vertex AI](https://votuduc.com/building-self-correcting-agentic-workflows-with-vertex-ai-p-20260321542526) (Gemini) platform, following the principle of least privilege.
-
Business Logic Orchestration: This is the brain of the operation. It houses the code that parses user commands, validates inputs, constructs the SQL queries, formulates the prompts for Gemini, and assembles the final response cards.
-
Error Handling and Logging: If any part of the chain fails—an invalid command, a BigQuery query error, or an API timeout—the MCP Server is responsible for catching the error and sending a helpful, user-friendly failure message back to Google Chat, while logging detailed diagnostic information for developers.
In essence, the MCP Server is the crucial middleware that connects the user interface (Google Chat) to the data backend (BigQuery) and the intelligence layer (Gemini Pro), enabling them to function as a single, cohesive application.
Building Your Google Chat OEE Bot Step-by-Step
With our architecture defined, it’s time to roll up our sleeves and bring this intelligent OEE bot to life. This section provides a practical, step-by-step guide to transforming your raw factory data into actionable insights delivered directly within your team’s collaboration hub. We’ll move sequentially from data storage to the final, polished user interface.
Step 1: Structuring Your Factory Data in BigQuery
Before we can query anything, we need a solid data foundation. The quality of your bot’s insights is directly proportional to the quality and structure of your underlying data. Google BigQuery, a serverless and highly scalable data warehouse, is the perfect repository for our time-series manufacturing data.
The key is to create a table schema that captures the fundamental components of OEE. A flat, denormalized structure is often most efficient for this type of analytical workload. Consider a schema like the one below, which records production data in regular intervals (e.g., every hour, or per production run).
Here is a sample CREATE TABLE statement to establish our oee_data table in BigQuery:
CREATE TABLE `your-gcp-project.your_dataset.oee_data`

(

event_timestamp TIMESTAMP NOT NULL,

machine_id STRING NOT NULL,

line_id STRING,

site_id STRING,

product_code STRING,

ideal_cycle_time_seconds FLOAT64,

total_parts_produced INT64,

good_parts INT64,

bad_parts INT64,

planned_runtime_seconds INT64,

unplanned_downtime_seconds INT64,

planned_downtime_seconds INT64

)

PARTITION BY

DATE(event_timestamp)

CLUSTER BY

machine_id, site_id;
Key Schema Considerations:
-
event_timestamp: This is the cornerstone of our time-series data. We partition the table by the date of this timestamp, which is a critical BigQuery best practice. It dramatically improves query performance and reduces costs by allowing the query engine to scan only the relevant date partitions. -
machine_id,line_id,site_id: These dimensional attributes allow us to slice and dice the data. We cluster by these fields, which co-locates data for the same machines or sites, further speeding up queries that filter or aggregate on them. -
OEE Components: The fields
ideal_cycle_time_seconds,good_parts,total_parts_produced,planned_runtime_seconds, andunplanned_downtime_secondsprovide all the raw inputs needed to calculate Availability, Performance, and Quality on the fly.
With this structure in place, you can set up your data ingestion pipelines (using tools like Dataflow, Pub/Sub, or direct IoT integrations) to populate this table with near real-time data from your factory floor.
Step 2: Developing the Google Chat App and Slash Command Interface
The user’s entry point to our system is the Google Chat App. We’ll use [AI Powered Cover Letter [Automated Job Creation in Real Time Jobber and Google Sheets Integration from Gmail](https://votuduc.com/Automated-Job-Creation-in-Jobber-from-Gmail-p115606) Engine](https://votuduc.com/AI-Powered-Cover-Letter-Automated Quote Generation and Delivery System for Jobber-Engine-p111092) as the serverless backend for our bot. It’s the perfect choice because it’s tightly integrated with [Automatically create new folders in Google Drive, generate templates in new folders, fill out text automatically in new files, and save info in [Automated Web Scraping with [Multilingual Text-to-Speech Tool with SocialSheet Streamline Your Social Media Posting 123](https://votuduc.com/Multilingual-Text-to-Speech-Tool-with-Google-Workspace-p809282)](https://votuduc.com/Automated-Web-Scraping-with-Google-Sheets-p292968)](https://workspace.google.com/marketplace/app/auto_create_folder_and_files/430076014869), requires zero server management, and handles authentication seamlessly.
First, you’ll need to create a new Google Cloud Project and enable the “Google Chat API”. Then, create a new Apps Script project linked to that Cloud Project.
The core of the user interaction is a slash command. This allows users to invoke our bot by simply typing /oee followed by their query. We define this command in the Apps Script manifest file, appsscript.json.
{

"timeZone": "America/New_York",

"dependencies": {

"enabledAdvancedServices": [

{

"userSymbol": "BigQuery",

"serviceId": "bigquery",

"version": "v2"

}

]

},

"exceptionLogging": "STACKDRIVER",

"runtimeVersion": "V8",

"chat": {

"slashCommands": [

{

"commandName": "/oee",

"description": "Get OEE metrics for a specific machine or line.",

"commandId": 1

}

]

}

}
With the manifest updated, we can write the main entry point function in our Code.gs file. Google Chat sends an event payload to this onMessage function whenever a user invokes our slash command.
/**

* Responds to a Google Chat message event.

*

* @param {Object} event the event object from Google Chat

*/

function onMessage(event) {

// Check if the message is a slash command

if (event.message.slashCommand) {

// Verify it's our /oee command

if (event.message.slashCommand.commandId == 1) {

const userQuery = event.message.argumentText.trim();

if (!userQuery) {

return { "text": "Please provide a query after the /oee command. For example: `/oee what was the OEE for line 5 yesterday?`" };

}

// In the next steps, we'll process this userQuery

// For now, let's just acknowledge it.

return { "text": `Processing your request: "${userQuery}"` };

}

}

// Default response if not a recognized command

return { "text": "I can only respond to the /oee slash command." };

}
This initial script simply acknowledges the user’s query. The event.message.argumentText property contains the raw text the user typed after /oee, which is the natural language query we’ll process in the next step.
Step 3: Integrating Gemini Pro to Parse Natural Language Queries
This is where we inject intelligence into our bot. Instead of forcing users to learn a rigid query syntax, we’ll use Google’s Gemini Pro large language model to understand their intent and extract the necessary parameters. Our goal is to convert a phrase like “OEE for the main press last week” into a structured JSON object that our code can use to query BigQuery.
The key to success is [Prompt Engineering for Reliable Autonomous Workspace Agents for Reliable Autonomous Workspace Agents](https://votuduc.com/prompt-engineering-for-reliable-autonomous-workspace-agents-p-20260319404106). We need to give the model a clear set of instructions, defining its role, the input it will receive, and the exact format of the output it must produce.
Here’s an effective system prompt designed for this task:
You are an expert manufacturing data analyst assistant integrated into a system that queries a BigQuery database. Your task is to parse a user's natural language query and extract key parameters.

The user's query will be about Overall Equipment Effectiveness (OEE).

You MUST extract the following entities:

- machine_id: The specific machine or line identifier mentioned.

- start_date: The start date for the query period in 'YYYY-MM-DD' format.

- end_date: The end date for the query period in 'YYYY-MM-DD' format.

- metric: The primary metric requested (e.g., "OEE", "Availability", "Performance", "Quality").

Rules:

1. Today's date is {{current_date}}.

2. If the user says "yesterday", the start_date and end_date should both be yesterday's date.

3. If the user says "last week", it refers to the most recently completed calendar week (Monday to Sunday).

4. If a parameter is not mentioned, use a null value for its key in the JSON.

5. You MUST respond ONLY with a single, valid JSON object and nothing else. Do not add any explanatory text or markdown formatting.
We would then combine this system prompt with the user’s actual query (userQuery from our Apps Script) and send it to the Vertex AI API.
Example Interaction:
-
Current Date: 2024-03-15
-
User Query:
show me the OEE for line 5 yesterday -
Expected Gemini Pro JSON Output:
{

"machine_id": "line 5",

"start_date": "2024-03-14",

"end_date": "2024-03-14",

"metric": "OEE"

}
In your Apps Script code, you would use the UrlFetchApp service to make an authenticated POST request to the Vertex AI endpoint for Gemini Pro. After receiving the response, you use JSON.parse() to convert the text output into a usable JavaScript object. This object now contains the precise parameters needed to build a dynamic SQL query against our BigQuery table.
Step 4: Designing Actionable KPI Cards for Chat Responses
A plain text response like “OEE was 78%” is functional but uninspiring. The Google Chat API allows for rich, interactive responses using Cards V2. These are JSON-defined UI components that can display information in a much more organized and visually appealing way.
A well-designed OEE card should present the primary KPI clearly at the top, followed by a breakdown of its constituent parts (Availability, Performance, Quality). This allows operators and managers to see not just the final score, but also why the score is what it is.
Here is an example of a JSON payload for an effective OEE results card:
{

"cardsV2": [

{

"cardId": "oeeCard",

"card": {

"header": {

"title": "OEE Analysis for Line 5",

"subtitle": "For Date: 2024-03-14",

"imageUrl": "https://img.icons8.com/color/48/000000/factory.png",

"imageType": "CIRCLE"

},

"sections": [

{

"header": "Overall Equipment Effectiveness (OEE)",

"collapsible": false,

"widgets": [

{

"decoratedText": {

"startIcon": {

"knownIcon": "STAR"

},

"text": "<b><font color=\"#008000\">81.5%</font></b>",

"topLabel": "World Class OEE is >= 85%"

}

}

]

},

{

"header": "Component Breakdown",

"collapsible": true,

"widgets": [

{

"columns": {

"columnItems": [

{

"horizontalSizeStyle": "FILL",

"widgets": [

{ "decoratedText": { "text": "<b>90.0%</b>", "topLabel": "Availability" } }

]

},

{

"horizontalSizeStyle": "FILL",

"widgets": [

{ "decoratedText": { "text": "<b>95.0%</b>", "topLabel": "Performance" } }

]

},

{

"horizontalSizeStyle": "FILL",

"widgets": [

{ "decoratedText": { "text": "<b>95.0%</b>", "topLabel": "Quality" } }

]

}

]

}

}

]

},

{

"widgets": [

{

"buttonList": {

"buttons": [

{

"text": "View Full Dashboard",

"onClick": {

"openLink": {

"url": "https://your-bi-tool.com/dashboards/oee?machine=line5&date=2024-03-14"

}

}

}

]

}

}

]

}

]

}

}

]

}
Your final Apps Script function would perform these actions in sequence:
-
Receive the user query from the
onMessageevent. -
Send the query to Gemini Pro to get structured JSON parameters.
-
Use these parameters to build and execute a SQL query against BigQuery.
-
Calculate the final OEE, A, P, and Q values from the query results.
-
Dynamically construct the Card V2 JSON object with these calculated values.
-
Return the complete card JSON as the function’s response, which Google Chat then renders beautifully for the user.
Putting It into Practice A COO’s Perspective
Technology is only as valuable as the operational improvements it drives. From a leadership perspective, the goal isn’t just to collect data; it’s to make that data accessible, actionable, and integrated into the daily workflow of our teams, from the plant floor to the executive suite. Moving OEE analytics into a conversational interface like Google Chat isn’t a novelty—it’s a fundamental shift in how we interact with our operational reality. It transforms data from a static report into a dynamic, collaborative partner.
Scenario Querying End-of-Shift Performance from Anywhere
Let’s consider a common scenario. I’m in an airport lounge between site visits, and the second shift at our primary facility has just ended. In the past, getting a clear picture of their performance meant one of several frustrating paths: waiting for a manually compiled email report that might arrive hours later, connecting to the company VPN to navigate a complex BI dashboard not optimized for mobile, or calling the shift supervisor, pulling them away from the crucial shift-change handover.
The new reality is profoundly different. I open Google Chat on my phone and type a simple command into a secure, dedicated channel:
/oee report plant_a line_3 last_shift
Within seconds, a cleanly formatted card appears directly in the chat:
**OEE Report: Plant A - Line 3**

**Period:** 2023-10-27 Shift 2 (15:00-23:00)

------------------------------------

- **OEE:** 78.5% (Target: 85%)

- **Availability:** 90.2%

- **Performance:** 91.5%

- **Quality:** 95.0%

**Top 3 Downtime Events:**

1. Feeder Jam (45 mins)

2. Unscheduled Maintenance (20 mins)

3. Material Shortage (12 mins)
This isn’t just data; it’s instant situational awareness. I have the critical KPIs and the “why” behind the numbers in less than 30 seconds, from anywhere in the world. I can now make a more informed call or, better yet, see that the team is already discussing the feeder jam in the same chat thread. This level of accessibility empowers leadership to stay connected without becoming a bottleneck.
From Reactive Problem-Solving to Proactive Optimization
The true power of this integration is how it elevates our operational cadence from reactive to proactive. While the end-of-shift query is a powerful tool for review, real-time alerts are what change the game during the shift itself.
We’ve configured our system to push automated notifications to specific Google Chat spaces based on predefined triggers. For example, if a critical production line’s OEE drops below 70% for more than 15 consecutive minutes, an alert is automatically posted in the “Plant A - Line 3 Operations” space.
This alert contains:
-
The line and current OEE score.
-
The specific metric that triggered the drop (e.g., “Performance at 65%”).
-
A link to a detailed real-time dashboard for deeper analysis.
The on-site shift lead, maintenance technician, and quality engineer see this alert simultaneously. The conversation to diagnose and resolve the issue begins immediately, right there in the chat thread, attached to the data that triggered it. This creates a documented, time-stamped record of the incident and its resolution.
This simple workflow transforms our dynamic:
-
Before: A problem occurs. It might go unnoticed until a quality check or an end-of-shift review. The investigation is a forensic exercise, looking back at what happened.
-
After: A problem begins to emerge. The system flags it in real-time. The team swarms it, collaborates in a shared space, and resolves it. The conversation and data provide a valuable entry for our continuous improvement (Kaizen) events. We are no longer just solving problems; we are building a searchable knowledge base of how to prevent them in the future.
Scaling the Solution Across Multiple Plants and Production Lines
A solution for a single line is an interesting experiment. A solution that scales across a global enterprise is a competitive advantage. The architecture of a ChatOps-based system is inherently designed for scale.
Standardization and Accessibility: The same Google Chat application can serve our entire network of factories. The command structure remains consistent, whether a plant manager in Mexico is querying a local line or an executive in Germany is requesting a regional summary.
/oee summary region_emea last_24_hours
This standardized interface drastically reduces the training burden. We aren’t rolling out a new piece of software; we’re adding a powerful new contact to a tool our teams already use every day.
Data Governance and Security: Scalability requires robust governance. We manage this through Google Chat’s space-based permissions.
An* Executive OEE** space provides read-only access to query any plant or region.
A* Plant B Operations** space allows its members to query any line within Plant B and receive real-time alerts for that facility.
A* Line 5 Maintenance Crew** space might be restricted to detailed engineering metrics and downtime alerts for just that specific line.
This ensures that data is democratized responsibly. Teams get the granular information they need to do their jobs, while leadership gets the high-level view required for strategic decision-making, all through the same unified platform. This allows us to compare performance, identify systemic issues, and share best practices across our entire global footprint with unprecedented agility.
Conclusion: The Future of Data-Driven Plant Management
We’ve moved beyond the era where critical operational data was confined to static dashboards and periodic reports. The integration of real-time analytics into conversational platforms like Google Chat isn’t just a novelty; it represents a fundamental shift in how we interact with the pulse of our factory floor. By transforming data access from a passive, pull-based activity into an active, on-demand conversation, we are laying the groundwork for a more agile, responsive, and intelligent manufacturing environment. This is more than just a new way to view OEE—it’s the beginning of a new paradigm for operational excellence.
Empowering Your Leadership with On-Demand Intelligence
The true power of this solution lies in its ability to democratize data and empower decision-makers at every level. Plant managers, shift supervisors, and maintenance leads are no longer tethered to a control room or office computer. With a simple query from their mobile device, they can get an immediate, context-rich snapshot of equipment performance while walking the floor, attending a meeting, or troubleshooting an issue.
This immediacy collapses the time between insight and action. A sudden dip in a line’s performance score can be identified and investigated in minutes, not hours. This direct line to operational intelligence fosters a culture of proactive management, enabling leaders to anticipate problems, optimize resources dynamically, and make informed decisions with a speed that was previously unattainable. You’re not just providing data; you’re delivering actionable intelligence directly to the point of impact.
Beyond OEE: Expanding Conversational Analytics in Your Operations
While OEE is a powerful and universally recognized KPI, it’s merely the starting point. The architectural pattern we’ve explored—connecting a data source to a serverless function and exposing it via a chat interface—is a versatile and scalable framework for all your operational data. Imagine the possibilities when you expand the chatbot’s vocabulary:
-
Quality Control:
/qc-fails product-sku-123 last-shiftto instantly retrieve failure rates and reasons. -
Downtime Analysis:
/downtime-reason line-4to get a Pareto chart of the top stoppage causes for the day. -
Production Tracking:
/units-produced machine-7to check progress against the daily target. -
Maintenance Alerts: Proactive notifications when a machine’s sensor data (e.g., vibration, temperature) exceeds a predefined threshold.
By progressively adding these capabilities, you evolve from a simple OEE bot into a comprehensive digital assistant for your entire operation. This “conversational analytics” layer makes your complex data systems accessible to everyone, breaking down silos and ensuring that every team member is equipped with the information they need to excel.
Take the Next Step Towards a Smarter Factory Floor
Embarking on this journey toward a connected, conversational factory floor may seem daunting, but it begins with a single, focused step. The solution presented here is not an all-or-nothing proposition. Start small, prove the value, and build momentum.
-
Identify a Pilot: Select one critical production line and a key metric—OEE is an excellent choice—to serve as your proof-of-concept.
-
Map Your Data Flow: Understand where your target data resides (e.g., in an MES, a data historian, or a cloud database) and how you can securely access it.
-
Experiment and Iterate: Leverage the scalability of serverless and cloud platforms to build a small-scale version. Gather feedback from your team and continuously refine the functionality.
The future of manufacturing isn’t just about Automated Work Order Processing for UPS and robotics; it’s about creating a seamless symbiosis between human expertise and machine intelligence. By making data a fluent, conversational partner in your daily operations, you are not just optimizing a process—you are building the foundation for the truly smart factory of tomorrow.


Stop Doing Manual Work. Scale with AI.
Want to turn these blog concepts into production-ready reality for your team?
Table Of Contents
Portfolios
Related Posts
Quick Links
Legal Stuff