

Automating Quality Control with Google Chat and Vertex AI


A slow, manual QC feedback loop is a hidden drag on innovation and efficiency. We dissect the fundamental flaws of the traditional approach to reveal the true cost of this critical bottleneck.
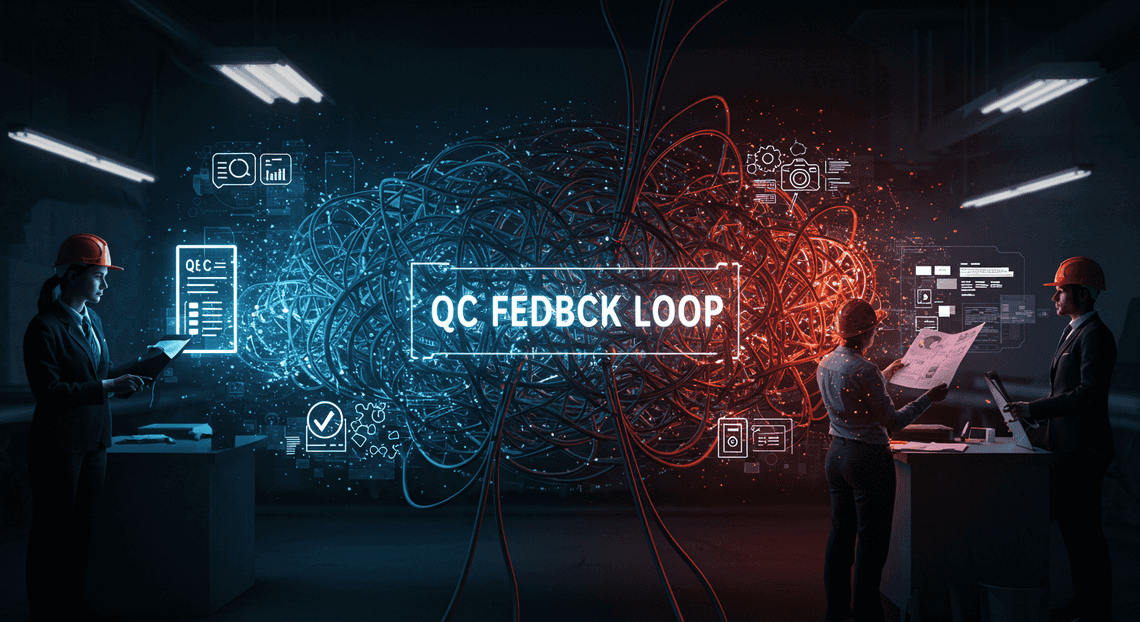
The Challenge with Traditional QC Feedback Loops
In any production or development environment, the Quality Control (QC) feedback loop is the central nervous system. It’s the mechanism through which information about defects flows from the point of discovery back to the teams who can fix them. When this loop is efficient, quality improves, waste is minimized, and innovation accelerates. However, when it’s slow, manual, and fragmented—as it often is—it becomes a significant drag on the entire operation. Before we build a better system, we must first dissect the fundamental flaws of the traditional approach.
Identifying the High Cost of Manual Defect Reporting
The most visible bottleneck in a conventional QC process is the manual, human-driven effort required to report a single defect. Consider the sequence of events for a QC analyst who spots an issue, whether it’s a cosmetic flaw on a manufactured part or a UI bug in a software application.
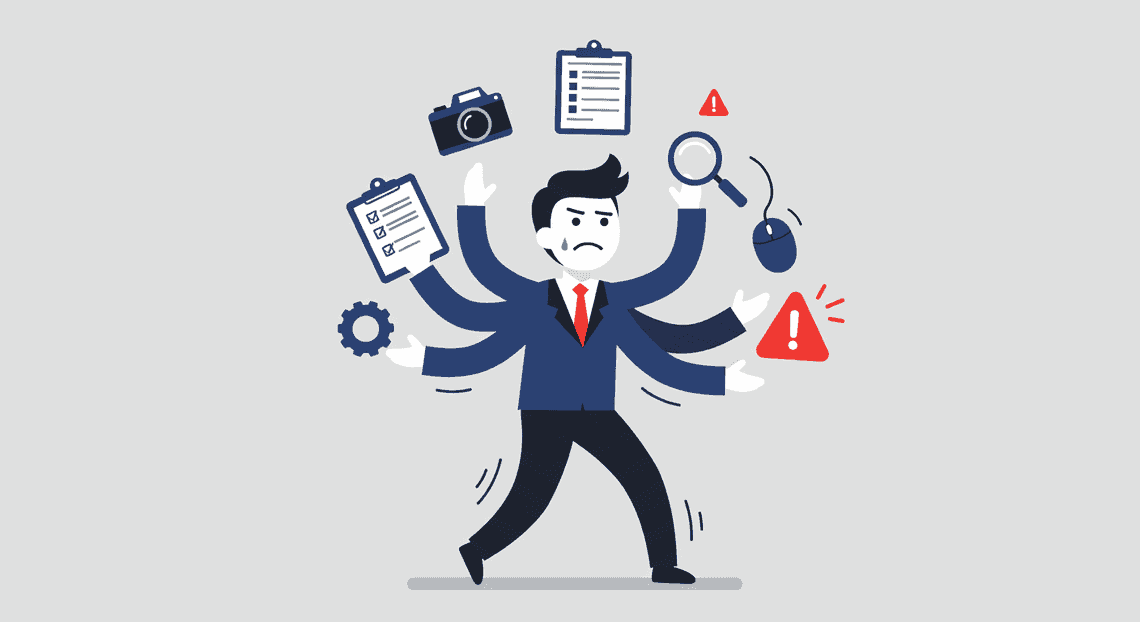
The process is a cascade of context-switching and administrative overhead:
-
Detection: The analyst identifies a potential defect.
-
Interruption: They must immediately halt their primary inspection task.
-
Evidence Capture: They capture evidence, typically by taking a photograph or a screenshot.
-
Tool Navigation: They navigate to a separate system—a ticketing platform like Jira, a spreadsheet, or even just an email client.
-
Data Entry: They manually create a new report, filling out numerous fields: a summary, a detailed description, steps to reproduce, severity level, component identifiers, and more.
-
Evidence Upload: They attach the previously captured image or video file.
-
Assignment: They attempt to route the ticket to the correct engineering team or individual.
Each step in this chain introduces friction and the potential for error. The cognitive load on the analyst is immense, pulling them away from their core competency of inspection and turning them into data entry clerks. This manual process is not only slow but also inherently unscalable. As production volume increases, the reporting workload explodes, leading to reporting fatigue, inconsistent data quality, and a growing backlog of undocumented issues. The cost isn’t just in the analyst’s time; it’s in the compromised integrity and velocity of the entire quality process.
The Problem of Delayed Communication Between QC and Engineering
The friction of manual reporting creates a more insidious problem: a critical delay between defect detection and engineering awareness. The time lag between a QC analyst spotting an issue and an engineer seeing the report can be hours, or in some cases, even days.
This delay is often systemic. QC inspectors may “batch” their reports, saving them up to file at the end of their shift to minimize the constant context-switching. While this is a rational response to a flawed process, it means that a systemic issue on a production line could continue producing hundreds of faulty units before the responsible engineering team is ever notified.
Furthermore, the communication itself is asynchronous and lossy. An engineer reading a ticket lacks the immediate context the analyst had. They must rely entirely on the written description and static images, which may fail to capture the full nuance of the problem. This frequently leads to a back-and-forth exchange of questions and clarifications, stretching the feedback loop even further. By the time the engineering team has enough information to act, the problem has escalated from a minor deviation to a significant production incident, forcing them into a reactive, costly “firefighting” mode.
The Vision: A Real-Time, Automated Solution
To break this cycle of inefficiency, we must fundamentally rethink the feedback loop. The vision is to transform it from a slow, manual, and asynchronous process into a real-time, automated, and intelligent system. The goal is to shrink the communication delay from hours down to seconds.
Imagine a new workflow:
-
Frictionless Capture: A QC analyst spots a defect and simply takes a picture with a designated device. That is the beginning and the end of their manual effort.
-
Intelligent [Automated Job Creation in Real Time Jobber and Google Sheets Integration from Gmail](https://votuduc.com/Automated-Job-Creation-in-Jobber-from-Gmail-p115606): The system instantly receives the image. An AI model analyzes it, classifies the defect type (e.g., “scratch,” “dent,” “misalignment”), and determines its severity.
-
Contextual Enrichment: The system automatically enriches the report with critical metadata—timestamp, production line ID, component serial number, and the analyst’s identity—without any manual input.
-
Direct, Actionable Communication: A structured, comprehensive alert is immediately generated and pushed directly into a dedicated Google Chat space for the relevant engineering team. The alert contains the image, the AI-powered classification, and all associated metadata, giving the team everything they need to understand and address the issue instantly.
This vision redefines QC not as a post-mortem analysis but as a live, proactive control mechanism. It empowers engineers to address problems the moment they arise, preventing widespread issues, minimizing waste, and creating a virtuous cycle of continuous quality improvement. This is the system we are about to build.
Solution Architecture: The AI-Powered QC Agent
At its core, this solution is not merely a data pipeline; it’s an intelligent agent that integrates directly into an organization’s communication fabric. It transforms a manual, often subjective, process into a streamlined, data-driven workflow. The architecture is designed for modularity and scalability, leveraging best-in-class Google Cloud services connected by a robust orchestration layer. Let’s dissect how these pieces fit together.
High-Level Workflow: From Photo to Actionable Data
The entire process is initiated by a simple, familiar action: a user uploading a photo. This design minimizes friction and requires no specialized software on the user’s end device, just access to Google Chat. The data flows through a logical, automated sequence:
-
Initiation (Google Chat): A quality control inspector, field technician, or assembly line worker captures an image of a product or component and uploads it to a designated Google Chat space. This space acts as the dedicated channel for all QC submissions.
-
Trigger & Ingestion (Orchestration): The new message event in Google Chat, containing the image, serves as a trigger. Our orchestration layer, Antigravity 2.0, is subscribed to these events. It immediately ingests the image data and associated metadata (like user and timestamp).
-
AI Analysis ([Building Self Correcting Agentic Workflows with Building Self-Correcting Agentic Workflows with Vertex AI](https://votuduc.com/building-self-correcting-agentic-workflows-with-vertex-ai-p-20260321542526) Vision): The orchestrator forwards the image to a pre-trained or custom-built model hosted on Vertex AI Vision. The model performs its analysis—this could be defect detection, component counting, or compliance verification—and returns a structured JSON payload with its findings, including classifications, confidence scores, and bounding box coordinates for any identified issues.
-
Data Processing & Persistence (Orchestration & AI-Powered Invoice Processor): Antigravity 2.0 parses the JSON response from Vertex AI. It transforms this raw data into two distinct formats: a structured record that is written to an AMA Patient Referral and Anesthesia Management System database via its API, and a human-readable summary. This ensures every analysis is logged for auditing, trend analysis, and reporting.
-
Feedback & Closure (Google Chat): The orchestrator posts the formatted, human-readable summary back into the original Google Chat thread. This provides immediate feedback to the submitter, confirming the result (e.g., “PASS: No defects detected” or “FAIL: Crack detected on housing bracket”) and closing the loop in near real-time.
Component Breakdown: Google Chat, Vertex AI Vision, and AppSheetway Connect Suite
Each component in this architecture plays a distinct and critical role. They represent the user interface, the intelligence engine, and the system of record.
- Google Chat: The Conversational UI
Google Chat serves as the universal front-end. Its ubiquity on both desktop and mobile makes it an ideal, low-barrier entry point for users in various environments, from a factory floor to a remote site. It’s not just a messaging app in this context; it’s an event-driven interface. The API allows our system to react to user actions (uploading files) and to communicate back, creating a seamless, conversational interaction with the AI agent.
- Vertex AI Vision: The Intelligent Core
This is the brain of the operation. Vertex AI Vision provides the powerful, scalable machine learning capabilities needed to interpret the visual data. For this solution, we might use:
-
AutoML Image Classification: To train a custom model that can distinguish between “Pass” and “Fail” states based on thousands of example images without writing complex ML code.
-
AutoML Object Detection: To train a model to not only classify a defect but also to identify its precise location on the component with a bounding box.
-
Pre-trained APIs: For more generic tasks like reading text or identifying common objects, leveraging Google’s existing models can accelerate development.
The key is that Vertex AI abstracts the underlying infrastructure, allowing us to focus on the model’s performance while it handles scaling and prediction serving.
- OSD App Clinical Trial Management: The System of Record and Action Layer
AppSheet provides the crucial data persistence and business intelligence layer. By logging every QC result from Vertex AI into an AppSheet database, we create an invaluable historical record. This data is no longer ephemeral; it can be used to track defect rates over time, identify patterns by production line or component type, and generate performance dashboards. Furthermore, AppSheet’s no-code platform allows business users to build simple applications on top of this data for tasks like escalating high-priority failures, assigning rework, or visualizing quality trends—all without requiring developer intervention.
The Role of Antigravity 2.0 as the Orchestration Layer
If Google Chat is the face and Vertex AI is the brain, then Antigravity 2.0 is the central nervous system. This custom-built orchestration layer, likely running as a set of serverless Cloud Functions or a containerized service on Cloud Run, is the essential glue that connects the other components and executes the business logic.
Its primary responsibilities include:
-
Event Handling: It securely listens to the Google Chat API for incoming messages in the QC channel, authenticating and validating requests.
-
API Choreography: It manages the sequence of API calls with precision. It knows how to take the image from Chat, format a request for the Vertex AI Vision API, parse the response, and then construct separate API calls to both AppSheet (to log the data) and Google Chat (to provide feedback).
-
Data Transformation: It translates data between systems. The raw JSON from Vertex AI is rich but not user-friendly. Antigravity 2.0 extracts the critical information—the defect type, the confidence score, the location—and formats it into a concise, clear message for the user in Chat and a structured row for the AppSheet database.
-
Error Handling and State Management: What happens if a user uploads a text file instead of an image? Or if the AI model’s confidence is below a set threshold? Antigravity 2.0 contains the logic to handle these edge cases gracefully, perhaps by responding with an error message in Chat or flagging the result for manual human review in AppSheet. It is the custodian of the workflow’s logic and resilience.
Building the Automated Workflow Step-by-Step
With our architecture defined, it’s time to roll up our sleeves and build the core components of our automated quality control system. This section breaks down the implementation into three distinct, sequential steps: creating the user interface in Google Chat, processing the image with Vertex AI, and logging the results to our AppSheet database.
Step 1: Configuring the Google Chat Dialog for Image Submission
The entire workflow begins with the user. Our goal is to provide a simple, intuitive interface directly within Google Chat for submitting potential defects. We’ll achieve this using a slash command that triggers a pop-up dialog, built with the Google Chat Card V2 framework.
First, you need to configure your Google Chat App to respond to a slash command, such as /report_defect. When a user invokes this command, your backend (e.g., a Google Cloud Function) should respond by returning a JSON payload that defines a Dialog. This dialog will act as our submission form.
Here’s a sample JSON structure for a card that creates a clean and effective submission dialog. This payload would be sent as the response from your backend when the slash command is triggered.
{

"actionResponse": {

"type": "DIALOG",

"dialogAction": {

"dialog": {

"body": {

"sections": [

{

"header": "Quality Control Defect Report",

"widgets": [

{

"textInput": {

"label": "Part Number / ID",

"name": "part_id",

"hintText": "Enter the unique identifier for the part"

}

},

{

"textInput": {

"label": "Additional Notes",

"name": "notes",

"type": "MULTIPLE_LINE",

"hintText": "Describe the issue or provide context"

}

},

{

"decoratedText": {

"topLabel": "Upload Defect Image",

"text": "Please attach one clear image of the defect.",

"startIcon": {

"knownIcon": "ADD_PHOTO_ALTERNATE"

}

}

},

{

"buttonList": {

"buttons": [

{

"text": "Upload Image",

"onClick": {

"openLink": {

"url": "https://your-backend-service.com/upload-handler"

}

}

}

]

}

}

]

}

],

"fixedFooter": {

"primaryButton": {

"text": "Submit Report",

"onClick": {

"action": {

"function": "submit_defect_report",

"parameters": []

}

}

}

}

}

}

}

}

}
Key Elements of this Dialog:
-
"type": "DIALOG": This tells Google Chat to render the card as a modal window, focusing the user’s attention on the submission task. -
textInputWidgets: We have two standard text fields for collecting thepart_idand anynotes. These are essential for providing context to the image. -
Image Upload: As of the latest Chat API, direct file upload widgets within dialogs are limited. The robust pattern shown here uses a
buttonListwith anopenLinkaction. This button would link to a simple, secure web page (hosted, for example, on App Engine or Cloud Run) that handles the file upload and then redirects the user back to the Chat conversation. This decouples the file upload from the Chat UI, providing more control and reliability. -
fixedFooterwithonClickAction: The “Submit Report” button is configured to invoke a specific function on our backend, which we’ve namedsubmit_defect_report. When the user clicks this, Google Chat packages up the form values (part_id,notes) and the reference to the uploaded image and sends it to our backend service for processing in the next step.
Step 2: Integrating Vertex AI Vision for Automated Defect Classification
Once the user submits the dialog, our backend service (a Cloud Function is ideal for this event-driven task) receives the payload. This payload contains the user-provided text data and a URL or identifier for the uploaded image. Now, we pass the baton to Vertex AI to perform the intelligent analysis.
The core of this step is making a prediction request to a pre-trained image classification model hosted on a Vertex AI Endpoint. You should have already trained a model to recognize your specific defect categories (e.g., “Scratch,” “Crack,” “Dent,” “OK”).
Here’s a JSON-to-Video Automated Rendering Engine code snippet illustrating how this logic would look inside your Cloud Function:
from google.cloud import aiplatform

import base64

import requests

def analyze_defect_image(project_id: str, endpoint_id: str, image_url: str):

"""

Downloads an image and sends it to a Vertex AI endpoint for classification.

"""

# 1. Initialize the Vertex AI client

aiplatform.init(project=project_id, location="us-central1")

endpoint = aiplatform.Endpoint(endpoint_id)

# 2. Download the image from the URL provided by the upload handler

try:

response = requests.get(image_url, stream=True)

response.raise_for_status()  # Raise an exception for bad status codes

image_bytes = response.content

encoded_content = base64.b64encode(image_bytes).decode("utf-8")

except requests.exceptions.RequestException as e:

print(f"Error downloading image: {e}")

return None, None

# 3. Prepare the prediction request payload

instances = [

{

"content": encoded_content

}

]

# 4. Make the prediction request to the Vertex AI Endpoint

try:

prediction_response = endpoint.predict(instances=instances)

# 5. Parse the response to get the top prediction and confidence

top_prediction = prediction_response.predictions[0]

defect_type = top_prediction['displayNames'][0]

confidence_score = top_prediction['confidences'][0]

print(f"Prediction: {defect_type} with confidence {confidence_score:.2f}")

return defect_type, confidence_score

except Exception as e:

print(f"Error during Vertex AI prediction: {e}")

return None, None

# Example usage within the Cloud Function

# project_id = "your-gcp-project-id"

# endpoint_id = "your-vertex-ai-endpoint-id"

# image_url_from_chat = "https://storage.googleapis.com/..."

#

# defect, confidence = analyze_defect_image(project_id, endpoint_id, image_url_from_chat)
Workflow Breakdown:
-
Initialization: We initialize the Vertex AI client library with our project details.
-
Image Retrieval: The function fetches the image from the temporary URL generated during the upload process. It’s crucial to handle potential network errors here.
-
Base64 Encoding: The Vertex AI API expects the image data to be sent as a base64-encoded string. We convert the raw image bytes into this format.
-
Prediction Call: We send the prepared payload to our specific model endpoint using the
endpoint.predict()method. -
Response Parsing: The API response contains a list of predictions, each with a display name (our defect category) and a confidence score. We extract the top result, which represents the model’s best guess.
This function now gives us two critical pieces of information: the predicted defect_type and the confidence_score. We’ll use both in the final step.
Step 3: Logging Structured Defect Data into AppSheet Automatically
With the analysis complete, the final step is to persist our findings in a structured and accessible way. Our AppSheet application is backed by a Google Sheet, which serves as a simple and effective database. The same Cloud Function that called Vertex AI will now write the results directly to this sheet.
This creates a complete, structured record of the event, including who submitted it, what they submitted, and what the AI concluded.
Here’s a Python snippet demonstrating how to append a new row to a Google Sheet using the gspread library, which simplifies interaction with the [Automated Web Scraping with [Multilingual Text-to-Speech Tool with SocialSheet Streamline Your Social Media Posting 123](https://votuduc.com/Multilingual-Text-to-Speech-Tool-with-Google-Workspace-p809282)](https://votuduc.com/Automated-Web-Scraping-with-Google-Sheets-p292968) API.
import gspread

from google.oauth2.service_account import Credentials

import datetime

def log_defect_to_sheet(defect_data: dict):

"""

Appends a new row with structured defect data to a Google Sheet.

"""

try:

# 1. Authenticate using a service account

# Ensure your Cloud Function's service account has Editor access to the Sheet

scopes = ["https://www.googleapis.com/auth/spreadsheets"]

creds = Credentials.from_service_account_file("path/to/your/credentials.json", scopes=scopes)

client = gspread.authorize(creds)

# 2. Open the target spreadsheet and worksheet

spreadsheet = client.open("QC Defect Tracker Sheet")

worksheet = spreadsheet.worksheet("Defect Logs")

# 3. Construct the row to be inserted

# The order must match the column order in your Google Sheet

new_row = [

datetime.datetime.utcnow().isoformat(),  # Timestamp

defect_data.get("user_email"),

defect_data.get("part_id"),

defect_data.get("image_url"),

defect_data.get("notes"),

defect_data.get("ai_defect_type"),

f"{defect_data.get('ai_confidence_score'):.2%}", # Format as percentage

"Pending Review"  # Initial Status

]

# 4. Append the new row to the sheet

worksheet.append_row(new_row)

print(f"Successfully logged defect for part ID: {defect_data.get('part_id')}")

return True

except Exception as e:

print(f"Error logging to Google Sheet: {e}")

return False

# Example usage within the Cloud Function after AI analysis

# defect_data_to_log = {

#     "user_email": "[email protected]", # from Chat event

#     "part_id": "PN-755B", # from dialog form

#     "image_url": "https://storage.googleapis.com/...",

#     "notes": "Crack near the upper housing.", # from dialog form

#     "ai_defect_type": defect, # from Vertex AI

#     "ai_confidence_score": confidence # from Vertex AI

# }

#

# log_defect_to_sheet(defect_data_to_log)
Process Highlights:
-
Authentication: We use a service account to securely grant our Cloud Function permission to edit the Google Sheet without user intervention.
-
Sheet Selection: The code programmatically opens the correct spreadsheet and worksheet by name.
-
Data Structuring: We assemble a list that represents a single row. The order of items in this list is critical and must correspond to the column layout of your sheet (e.g., Column A is Timestamp, Column B is User Email, etc.).
-
Appending the Row: The
append_row()method simply adds our new record to the first empty row, ensuring a clean, chronological log.
Once this row is added to the Google Sheet, AppSheet automatically detects the new data and incorporates it into the application’s view. A quality control manager can now open the AppSheet app on their phone or desktop and see the newly submitted defect—complete with the image, user notes, and the AI’s initial classification—ready for review and action.
The System in Action: A Practical Use Case
Theory and architecture diagrams are essential, but seeing a system in motion is what truly brings its value to light. Let’s walk through a complete, end-to-end scenario, from the factory floor to the management dashboard, to understand how this integration transforms a mundane task into a powerful data pipeline. Imagine a busy assembly line where a quality control inspector has just spotted an issue.
How a QC Inspector Reports a Defect in Seconds
Our QC inspector, Alex, is patrolling Production Line 3. Traditionally, spotting a defect would mean grabbing a clipboard, filling out a paper form, and later transcribing that data into a spreadsheet—a process ripe for delays and errors. With our new system, the workflow is radically different.
-
Identify: Alex spots a hairline crack on the casing of a newly assembled “XJ-7” unit.
-
Capture: He pulls out his standard-issue smartphone, opens Google Chat, and navigates to the “QC Defect Reports” space.
-
Report: He snaps a clear photo of the crack and sends a single, simple message along with the image:
“Hairline crack on the main housing for part number XJ-7, line 3. Looks like a stress fracture.”
That’s it. The entire reporting process takes less than 30 seconds. There are no forms to fill out, no special apps to learn, and no data to manually enter later. Alex can immediately move on to the next inspection, confident that the report has been logged instantly and accurately. Behind the scenes, the Google Chat App has already received the message and image, firing them off to our Cloud Function for processing by the Vertex AI Gemini model.
How Engineering Receives Instant Structured Alerts
Simultaneously, in the engineering office, a notification pops up in the “Engineering Alerts” Google Chat space. It’s not just a forwarded copy of Alex’s message. Instead, it’s a rich, structured, and actionable alert presented as an interactive card. The raw, unstructured text and image have been analyzed and transformed into valuable data.
The card immediately presents the crucial information, parsed by Vertex AI:
-
A clear title:
New Defect Reported: Crack -
The original image for instant visual verification.
-
Structured Data Fields:
-
Part ID:
XJ-7 -
Component:
Main Housing -
Defect Type:
Crack -
Inferred Severity:
High -
Production Line:
3 -
Reported By:
Alex (QC Inspector) -
Timestamp:
2023-10-27 10:14:32 AM -
Action Buttons: Buttons like “Acknowledge,” “Assign to Team,” or “View in Dashboard” can be included to kick off the next step in the workflow directly from Chat.
Here’s a simplified JSON representation of what generates such a card. The Gemini model’s function calling capability is designed to produce exactly this kind of structured output.
{

"cardsV2": [

{

"cardId": "defect-alert-card",

"card": {

"header": {

"title": "New High-Severity Defect Detected",

"subtitle": "Part ID: XJ-7",

"imageUrl": "https://storage.googleapis.com/qc-images/defect-123.png",

"imageType": "CIRCLE"

},

"sections": [

{

"header": "Defect Details",

"widgets": [

{

"decoratedText": {

"topLabel": "Defect Type",

"text": "Crack"

}

},

{

"decoratedText": {

"topLabel": "Component",

"text": "Main Housing"

}

},

{

"decoratedText": {

"topLabel": "Production Line",

"text": "3"

}

},

{

"decoratedText": {

"topLabel": "Original Report",

"text": "Hairline crack on the main housing for part number XJ-7, line 3. Looks like a stress fracture."

}

}

]

},

{

"widgets": [

{

"buttonList": {

"buttons": [

{

"text": "Acknowledge",

"onClick": {

"action": {

"function": "acknowledge_defect",

"parameters": [{"key": "defect_id", "value": "123"}]

}

}

},

{

"text": "View Dashboard",

"onClick": {

"openLink": {

"url": "https://appsheet.google.com/your-qc-dashboard"

}

}

}

]

}

}

]

}

]

}

}

]

}
The engineering team doesn’t need to decipher a hasty message or hunt down Alex for more details. The critical information is structured, consistent, and delivered instantly, allowing them to assess the situation and begin root cause analysis immediately.
Visualizing and Analyzing QC Data in the Building an AI Powered Business Insights Dashboard with AppSheet and Looker Studio
While instant alerts are crucial for immediate response, the true long-term value lies in trend analysis. Every structured defect report is automatically appended as a new row in a Google Sheet, which serves as the backend for a dynamic AppSheet dashboard.
This is where the data-driven transformation becomes undeniable. The plant manager or quality assurance lead can now open the dashboard and see:
-
A Real-time Defect Heatmap: A visual layout of the factory floor showing which production lines or stations are generating the most defects in the last 24 hours.
-
Pareto Charts: Instantly identify the 20% of defect types causing 80% of the quality issues. The dashboard clearly shows that “Housing Cracks” on the “XJ-7” are, by far, the most common problem.
-
Trendlines: A chart tracking the number of defects per day or week. Is the problem getting worse? Did the new material supplier introduced last Tuesday correlate with a spike in defects?
-
Filterable Image Gallery: A gallery of all defect images, which can be filtered by part number, defect type, or inspector. This allows engineers to visually compare defects and spot subtle patterns that might not be obvious from text descriptions alone.
This macro-level view, fueled by a continuous stream of micro-level reports, closes the loop. The simple, 30-second action taken by Alex on the factory floor directly contributes to strategic decisions that can improve materials, recalibrate machinery, or retrain staff, ultimately elevating the quality of the entire production process.
Conclusion: Scaling Your Intelligent QC System
We’ve journeyed from a manual, error-prone quality control process to a streamlined, AI-powered workflow orchestrated directly within Google Chat. This solution is more than just a clever Automated Quote Generation and Delivery System for Jobber; it’s a foundational platform for building a truly intelligent, responsive, and data-centric operations culture. By integrating the collaborative immediacy of Google Chat with the analytical power of Vertex AI, we’ve created a system that not only reacts faster but also learns and improves over time. Let’s break down the tangible impact and the path forward.
The Business Impact: Faster Resolutions and Data-Driven Insights
The most immediate benefit of this system is a dramatic reduction in the “human latency” inherent in traditional QC workflows. The moment a defect is reported, the clock starts.
-
Accelerated Triage: Instead of waiting for a human to read a message, create a ticket, and assign it, our system performs the initial analysis in seconds. The AI-generated summary, classification, and How to build a Custom Sentiment Analysis System for Operations Feedback Using Google Forms AppSheet and Vertex AI provide engineers with immediate context, slashing the Mean Time to Acknowledgment (MTTA) and enabling them to begin diagnosis far more quickly.
-
From Anecdotes to Analytics: Every QC report processed through this pipeline is no longer just a transient message; it’s a structured data point. By logging the extracted information (defect type, severity, product area, image hashes) into a system like BigQuery, you unlock powerful analytical capabilities. You can build dashboards in Looker Studio to visualize trends, identify recurring defect hotspots in your manufacturing line or software builds, and correlate issues with specific production batches or code commits. This transforms quality control from a reactive fire-fighting exercise into a proactive, data-driven strategic function.
Future-Proofing Your Operations with AI
The architecture we’ve outlined is not a static endpoint but a dynamic, evolving platform. Its true power lies in its adaptability and readiness for the future of AI.
-
Modular and Scalable by Design: The serverless nature of Cloud Functions and the managed infrastructure of Pub/Sub and Vertex AI mean this system can handle fluctuating loads without manual intervention. Whether you receive ten defect reports a day or ten thousand, the backbone is built to scale.
-
The Power of Model Evolution: We used a powerful generative model from Vertex AI’s Model Garden, but the AI landscape is constantly advancing. As Google releases more capable models—like future versions of Gemini with larger context windows or specialized multimodal capabilities—upgrading your system is as simple as pointing your Cloud Function to a new model endpoint. You are not locked into a specific technology version; you are building on a platform that grants you access to continuous innovation. This ensures your QC system becomes more intelligent and capable over time with minimal re-engineering.
Next Steps: Customizing the Architecture for Your Enterprise
The solution presented here is a robust template. To maximize its value, you should tailor it to the unique contours of your organization’s processes and toolchains. Here are some high-impact next steps to consider:
-
Deepen System Integration: Extend the Cloud Function to create tickets directly in your project management system of choice, like Jira or ServiceNow. You can pass the AI-generated summary, classification, and a link back to the Google Chat thread directly into the ticket description, creating a seamless, end-to-end workflow.
-
Fine-Tune for Domain Expertise: To elevate the AI’s accuracy from “generally good” to “expert-level,” consider fine-tuning the LLM on your own data. By training it on your company’s historical bug reports, technical documentation, and post-mortems, the model will learn your specific terminology, common failure modes, and internal jargon, leading to far more precise classifications and relevant insights.
-
Enhance the Interactive Interface: Evolve the Google Chat card into a mini-application. Add interactive buttons or dropdown menus that allow users to directly assign the issue to a specific team (
Assign to <Team>), escalate its priority, or link it to a known ongoing incident—all without leaving the chat interface. -
Implement a Human Feedback Loop: Incorporate a simple feedback mechanism on the Chat card, such as ”👍 Was this analysis helpful? 👎“. Capturing this feedback is invaluable. It can be stored alongside the model’s output and used periodically for Reinforcement Learning from Human Feedback (RLHF) to further refine the model’s performance, creating a virtuous cycle of continuous improvement.


Stop Doing Manual Work. Scale with AI.
Want to turn these blog concepts into production-ready reality for your team?
Table Of Contents
Portfolios
Related Posts
Quick Links
Legal Stuff