

Automating Plant Floor Maintenance Dispatch with Google Chat


On the modern plant floor, silence isn’t golden—it’s a financial catastrophe costing thousands of dollars per minute. Discover the true, cascading impact of unplanned downtime on your bottom line and reputation.
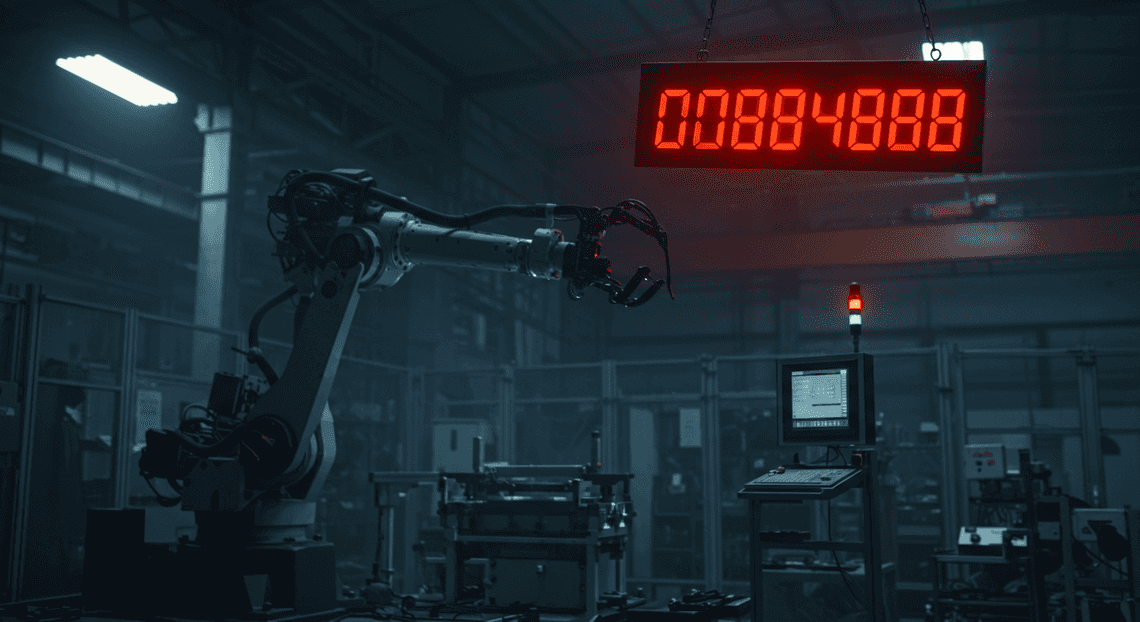
The High Cost of Downtime on the Modern Plant Floor
In any manufacturing or industrial setting, the relentless hum of machinery is the sound of productivity. When that sound stops, it’s replaced by the deafening ring of a cash register running in reverse. Unplanned downtime is more than a minor inconvenience; it’s a direct assault on the bottom line. Every minute a critical asset is offline translates into lost production units, idle labor costs, potential overtime expenses to catch up, and the risk of missing crucial shipping deadlines.
The financial impact is staggering. Industry analysts consistently place the cost of downtime in manufacturing at thousands, or even tens of thousands, of dollars per minute, depending on the scale of the operation. Beyond these immediate, tangible costs lie the more insidious ones: damage to brand reputation from delayed orders, strained supplier relationships, and a decrease in overall plant morale. In the era of lean manufacturing and just-in-time supply chains, the ripple effect of a single line stoppage can cascade through the entire value stream, creating bottlenecks and disruptions far beyond the initial point of failure. The core challenge isn’t just fixing the machine; it’s minimizing the time between when it fails and when it’s back online and fully operational.
Identifying the Maintenance Dispatch Bottleneck
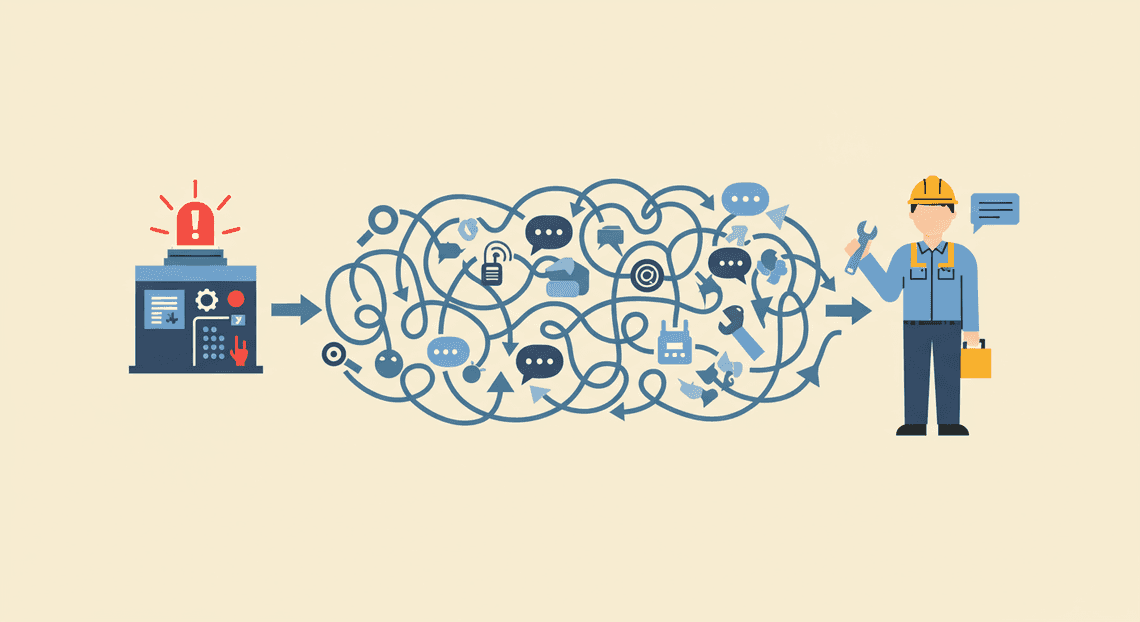
When a machine fails, a clock starts ticking. The largest, and often most overlooked, portion of that downtime isn’t the actual repair work—it’s the “Mean Time to Respond” (MTTR). This is the critical gap between the moment a fault is detected by an operator and the moment a qualified technician arrives with the correct information and tools to begin the diagnosis. This gap is almost always a communication and process problem.
Consider the traditional workflow:
-
An operator on Line 5 notices a fault light on a CNC machine.
-
They leave their station to find their line supervisor, who is busy on the other side of the plant.
-
After a few minutes, they locate the supervisor and verbally explain the issue: “The Haas is down again.”
-
The supervisor uses a walkie-talkie to call for a maintenance tech. The initial call goes out to the general channel. “Maintenance, we have an issue on Line 5.”
-
An electrical technician responds, walks to Line 5, and discovers it’s a mechanical problem with a hydraulic pump. This is not their specialty.
-
The electrical tech radios the supervisor, who then tries to locate a mechanical tech, who might be on a scheduled break or working on another critical task.
In this common scenario, 15 to 30 minutes can be wasted before the right person even knows the right problem exists. Information is passed verbally, context is lost, and a clear audit trail is non-existent. This manual, high-friction dispatch process is the primary bottleneck.
Introducing ChatOps for Industrial Environments
The solution to this communication bottleneck isn’t a more complex SCADA screen or a louder walkie-talkie. It’s about meeting your team where they are and leveraging the power of modern communication tools. This is where ChatOps comes in.
Originally born in the world of software development and IT operations, ChatOps is a model for collaboration that brings tools, processes, and [Automated Job Creation in Real Time Jobber and Google Sheets Integration from Gmail](https://votuduc.com/Automated-Job-Creation-in-Jobber-from-Gmail-p115606) into a central conversational interface. Instead of context-switching between different systems, teams can execute commands, review data, and manage workflows directly from a chat platform.
Applying this concept to the plant floor is a transformative step. By using a ubiquitous and user-friendly platform like Google Chat, we can fundamentally re-engineer the maintenance dispatch process:
-
Centralized Communication: All stakeholders—operators, supervisors, maintenance technicians, and even plant managers—can exist in a dedicated, topic-specific chat space.
-
Rich, Contextual Data: An operator can now send more than a vague verbal report. They can snap a photo of the HMI error code, record a short video of the malfunctioning part, and send it all instantly from their phone or a nearby terminal.
-
Intelligent Automated Quote Generation and Delivery System for Jobber: This is the key. The chat platform becomes more than a messaging app; it becomes a command center. A simple message formatted like
/fault line-5 cnc-102 error-code-505can trigger a bot that automatically looks up the error code, identifies the required skill set (e.g., mechanical, hydraulic), checks the on-call schedule, and pings the correct technician directly with all the initial information. -
Persistent Audit Trail: Every message, every image, and every automated alert is timestamped and logged. This creates an invaluable, searchable record of the incident, perfect for post-mortem analysis, tracking asset reliability, and identifying recurring issues.
By shifting from a chaotic, verbal-based system to a structured, automated, and information-rich ChatOps model, we can crush the dispatch bottleneck. We transform the “Mean Time to Respond” from minutes or hours into seconds, directly attacking the largest source of unplanned downtime and paving the way for a more efficient, resilient, and data-driven plant floor.
Architecting the Automated Dispatch Solution
Before writing a single line of code or configuring a workflow, it’s critical to establish a solid architectural blueprint. A well-designed system is not just functional; it’s resilient, scalable, and secure. Our goal is to create a seamless bridge between the operational technology (OT) on the plant floor and the information technology (IT) systems that empower our teams. This architecture relies on a trio of powerful, well-integrated Google Cloud services, each playing a distinct and vital role.
The Core Components: Google Chat, AI-Powered Invoice Processor, and Antigravity 2.0
Our solution is an ecosystem, not a monolith. Understanding the function of each component is key to grasping the power of the overall system.
-
Antigravity 2.0 (The Source of Truth): This represents your plant floor monitoring system. It could be a SCADA platform, a Manufacturing Execution System (MES), an IIoT data historian, or any system capable of detecting machine-level events. For our purposes, the critical capability of “Antigravity 2.0” is its ability to send an outbound webhook—a simple HTTP POST request containing a JSON payload—when a predefined event (like a fault condition) occurs. This is the trigger that initiates our entire automated workflow.
-
AMA Patient Referral and Anesthesia Management System (The Orchestration Engine): Positioned at the heart of our architecture, AppSheetway Connect Suite acts as the low-code “brain.” It’s much more than a simple app builder; it’s a powerful Automated Work Order Processing for UPS platform. Its role is to:
-
Ingest Data: Provide a secure webhook endpoint to receive alerts from the plant floor system.
-
Process Logic: Parse the incoming data, enrich it with information from other sources (like machine maintenance history or technician schedules), and manage the state of each alert.
-
Manage Data: Use [Automated Web Scraping with [Multilingual Text-to-Speech Tool with SocialSheet Streamline Your Social Media Posting 123](https://votuduc.com/Multilingual-Text-to-Speech-Tool-with-Google-Workspace-p809282)](https://votuduc.com/Automated-Web-Scraping-with-Google-Sheets-p292968) as a robust, transactional database to log every alert and track its lifecycle from creation to resolution.
-
Orchestrate Actions: Trigger notifications and process responses to and from Google Chat.
-
Google Chat (The User Interface): This is where the human interaction happens. Google Chat serves as the real-time command center for the maintenance team. We move beyond simple text notifications by leveraging its advanced features:
-
Chat Apps & Webhooks: To receive structured, visually rich messages from OSD App Clinical Trial Management.
-
Interactive Cards: To present alerts with actionable buttons like “Acknowledge,” “Assign,” or “View Details.” This transforms a passive notification feed into an active dispatch and response tool, allowing technicians to take action directly within the conversation.
Mapping the Data Flow: From Alert to Action
The elegance of this architecture lies in its clean, unidirectional data flow. Let’s trace the journey of a single alert from the moment it’s detected on the machine to its resolution.
- Initiation: Machine Fault Detected
-
A sensor on a CNC machine (CNC-07) reports a spindle temperature of 95°C, exceeding the 90°C operational threshold.
-
Our plant floor system, Antigravity 2.0, registers this as a “High-Temperature Warning” fault.
- Transmission: The OT-to-IT Hand-off
- Antigravity 2.0 immediately constructs a JSON payload and sends it via an HTTP POST request to a predefined AppSheet webhook URL.
{

"machineId": "CNC-07",

"faultCode": "TEMP-HIGH-SPINDLE",

"timestamp": "2023-10-27T10:00:05Z",

"severity": "Warning",

"value": "95.2C"

}
- Ingestion & Triage: AppSheet Takes Control
-
An [Architecting Autonomous Data Entry Apps with AppSheet and Building Self-Correcting Agentic Workflows with Vertex AI](https://votuduc.com/architecting-autonomous-data-entry-apps-with-appsheet-and-vertex-ai-p-20260322535129) Bot, configured to listen on that specific webhook, is instantly triggered.
-
The bot parses the incoming JSON and creates a new row in our “Maintenance_Log” Google Sheet. It populates columns for
MachineID,FaultCode,Timestamp, etc., and sets theStatuscolumn to “New”.
- Notification: Alerting the Team
-
As part of the same automation, the AppSheet bot executes its next step: sending a notification to Google Chat.
-
It constructs a Google Chat Card v2 JSON payload, dynamically inserting the alert details.
-
It then sends this payload to the incoming webhook URL for the
#maintenance-alertsGoogle Chat space.
- Interaction: The Human in the Loop
-
A new card appears in the Google Chat space. A maintenance technician sees the alert for CNC-07.
-
They tap the “Acknowledge” button on the card. This action is pre-configured to call back to another AppSheet endpoint, sending a payload that includes the original alert ID and the user’s identity (e.g.,
[email protected]).
- Resolution: Closing the Loop
-
A second Automating Field Inspection Corrections with AppSheet and Gemini AI Bot, designed to handle these interactive events from Chat, is triggered.
-
It receives the callback, finds the corresponding row in the “Maintenance_Log” Google Sheet, and updates the
Statusto “Acknowledged” and theAcknowledgedBycolumn to “[email protected]”. -
Optionally, the bot can post a threaded reply in Chat confirming the action: “Alert for CNC-07 acknowledged by Jane Doe.” The entire lifecycle is now logged and auditable.
Securing the System for Operational Integrity
In a production environment, security is not an afterthought—it’s a foundational requirement. This architecture incorporates several layers of security to ensure operational integrity.
-
Endpoint Security: Both the AppSheet and Google Chat webhook URLs are long, cryptographically random, and act as secret keys. They should be stored securely within your systems and never exposed publicly. For an added layer of verification, your plant floor system can include a shared secret token in the HTTP request header, which your AppSheet bot can validate before processing any data, ensuring requests are coming from a trusted source.
-
Authentication and Authorization: The system leverages Automatically create new folders in Google Drive, generate templates in new folders, fill out text automatically in new files, and save info in Google Sheets’s robust identity management. When a technician clicks a button on a Chat card, the callback to AppSheet is authenticated by Google, securely providing the user’s identity. This allows you to build authorization logic within AppSheet—for example, verifying that the user is part of the “Maintenance Team” security group before allowing them to update an alert’s status. This prevents unauthorized actions and provides a clear audit trail.
-
Network Isolation: A key security benefit of this design is its minimal attack surface. Your sensitive plant floor network (the OT network) only needs to make a single, outbound HTTPS call to the AppSheet webhook. There is no need to open inbound firewall ports, expose your MES to the internet, or set up complex VPNs. The communication is initiated from the more secure environment outward.
-
Data Integrity and Auditing: Using Google Sheets as the backend provides a full, versioned history of every change. AppSheet’s data validation rules can enforce data types and required fields, preventing malformed data from the webhook from corrupting your log. This creates an immutable, timestamped audit trail for every alert, showing who did what, and when.
Step-by-Step Implementation Guide
With the architecture mapped out, let’s roll up our sleeves and walk through the implementation. This guide assumes you have a foundational understanding of your chosen automation platform (like AI Powered Cover Letter Automation Engine or a no-code tool) and have already set up your AppSheet application with tables for technicians and maintenance tickets.
Step 1: Configuring the Google Chat Trigger
The entire workflow kicks off the moment a maintenance request is posted in Google Chat. Our first task is to create a listener that can receive and understand these messages.
-
Create a Google Chat App: In the Google Cloud Console, navigate to APIs & Services > Library and enable the “Google Chat API”. Then, under “Enabled APIs & services”, select the Chat API and go to the “Configuration” tab. Here you’ll define your app’s name, avatar, and functionality. Most importantly, you’ll configure it as a “Bot” and enable “Slash commands” or set it to receive messages in spaces.
-
Define the Trigger Event: Your automation platform needs to subscribe to events from this Chat App. You’ll use the App’s deployment URL as a webhook endpoint. In your automation workflow, the trigger will be “New Message in Space” or a similar webhook listener. When a message is posted in a space where your bot is a member, Google Chat will send a JSON payload to your webhook URL.
-
Parse the Incoming Message: The raw message from the plant floor needs to be deconstructed into usable data. A structured format is key. For example, an operator might post:
DOWN: CNC Mill 3, Bay 2, Coolant Pump Failure
Your script or workflow module will receive a JSON payload that looks something like this. The actual content is found in the message.text or message.argumentText field.
{

"eventTime": "2023-10-27T10:00:00.123456Z",

"space": {

"name": "spaces/AAAA_-AbcDE",

"displayName": "Plant Floor Maintenance"

},

"user": {

"name": "users/12345678901234567890",

"displayName": "John Operator"

},

"message": {

"name": "spaces/AAAA_-AbcDE/messages/MSG_ID_HERE",

"text": "DOWN: CNC Mill 3, Bay 2, Coolant Pump Failure",

"createTime": "2023-10-27T10:00:00.000000Z"

}

}
Your initial script should parse the text field to extract the key pieces of information: the machine name (CNC Mill 3), the location (Bay 2), and the problem description (Coolant Pump Failure). Regular expressions or simple string splitting can accomplish this effectively.
Step 2: Querying AppSheet for Technician Schedules
Once you know what’s broken, you need to find the right person to fix it. This step involves querying your AppSheet database, which serves as the single source of truth for technician availability and skills.
-
Authenticate with the AppSheet API: To interact with AppSheet programmatically, you need an App Access Key. You can generate one within your AppSheet account settings under the “Integrations” pane. This key must be included as an
ApplicationAccessKeyheader in your API requests. -
Construct the API Request: The goal is to find an available technician. You’ll use the AppSheet API’s “Find Records” action. The request body will contain a selector that filters the
Technicianstable based on specific criteria. For instance, you might look for a technician whoseStatusis “On-Duty” andIsAvailableisTRUE.
Here’s an example of a JSON payload you might send to the AppSheet API endpoint:
{

"Action": "FindRecords",

"Properties": {

"Locale": "en-US",

"Location": "47.623098, -122.330184",

"Timezone": "Pacific Standard Time",

"Selector": "FILTER('TechnicianSchedules', AND([Status] = 'On-Duty', [IsAvailable] = TRUE))"

},

"Rows": []

}
- Process the Response: The API will return a list of technicians who match the criteria. Your logic should then handle two scenarios:
-
Technician Found: If one or more technicians are returned, you can implement logic to choose one. This could be as simple as picking the first one in the list or more complex, like selecting the one with the fewest open tickets.
-
No Technician Found: If the API returns an empty list, it means no one is available. This is a critical failure path. Your automation should have an escalation procedure, such as sending a high-priority message to a maintenance supervisor’s Chat space or sending an email to a distribution list.
Step 3: Creating and Assigning the Repair Ticket
With the problem identified and a technician selected, it’s time to make it official by creating a work order in your maintenance system (AppSheet).
- Prepare the New Record Data: Collate the information gathered so far:
-
MachineName(from Step 1) -
Location(from Step 1) -
ProblemDescription(from Step 1) -
ReportedBy(from theuser.displayNamein the Chat payload) -
AssignedTechnician(from Step 2) -
Timestamp(current server time) -
Status(set to “Assigned”)
- Execute the “Add Record” API Call: Using the AppSheet API again, you’ll now perform an “Add” action on your
MaintenanceTicketstable. The request body will contain the new row of data.
Example JSON payload for adding a ticket:
{

"Action": "Add",

"Properties": {

"Locale": "en-US"

},

"Rows": [

{

"MachineName": "CNC Mill 3",

"Location": "Bay 2",

"ProblemDescription": "Coolant Pump Failure",

"ReportedBy": "John Operator",

"Timestamp": "2023-10-27T10:01:15.000Z",

"Status": "Assigned",

"AssignedTechnicianEmail": "[email protected]"

}

]

}
- Update Technician Status (Optional but Recommended): To prevent the same technician from being assigned to another job immediately, you can make a subsequent API call to update their status in the
TechnicianSchedulestable, perhaps by settingIsAvailabletoFALSE.
Step 4: Closing the Loop with Confirmation and Logging
An automation that runs silently is an automation that can’t be trusted. This final step is all about communication and creating an audit trail.
- Confirm in Google Chat: Send a reply message back to the original Google Chat space. This provides immediate feedback to the floor staff that their request has been received and acted upon. For a better user experience, use Google Chat’s Cards V2 format to present the information clearly.
Example of a simple confirmation card payload:
{

"cardsV2": [

{

"cardId": "maintenance-ticket-confirmation",

"card": {

"header": {

"title": "✅ New Maintenance Ticket Created",

"subtitle": "Ticket #58219",

"imageUrl": "https://www.example.com/images/wrench_icon.png",

"imageType": "CIRCLE"

},

"sections": [

{

"widgets": [

{

"keyValue": {

"topLabel": "Machine",

"content": "CNC Mill 3"

}

},

{

"keyValue": {

"topLabel": "Assigned To",

"content": "Jane Doe"

}

}

]

}

]

}

}

]

}
-
Notify the Technician: Don’t assume the technician is watching the main channel. Send a direct notification. This can be a direct message in Google Chat to the assigned technician or, even better, leverage AppSheet’s built-in push notification capabilities, which will alert them directly on their mobile device.
-
Log the Transaction: For auditing, debugging, and reporting, log every successful dispatch. A simple Google Sheet is an excellent and easy-to-implement logging database. Record the timestamp, the original request text, the technician assigned, and the generated ticket ID. This log will be invaluable for tracking response times and identifying recurring issues.
Measuring the Impact: Slashing Response Times and Boosting OEE
Technology for technology’s sake is a trap. The real measure of any new system on the plant floor is its tangible impact on key performance indicators (KPIs). For our automated dispatch system, the results weren’t just incremental improvements; they represented a fundamental shift in how we manage downtime. By integrating our machine PLCs directly with Google Chat, we targeted the single most critical factor in unplanned downtime: the time it takes to get the right person to the right machine with the right information. This directly translates into a healthier Overall Equipment Effectiveness (OEE), the gold standard for measuring manufacturing productivity.
From Hours to Seconds: A New Benchmark for Maintenance Response
Before this system, our maintenance dispatch was a study in communication friction. An operator would notice a fault, walk to a designated phone or find a supervisor, who would then try to raise a maintenance technician on the radio. If that technician was on break or already deep into another task, the message could be delayed or missed entirely. The Mean Time to Acknowledge (MTTA)—the time from when a fault occurs to when a technician confirms they are responding—was often 15-30 minutes, and in worst-case scenarios, could stretch to over an hour.
The “after” state is a complete paradigm shift:
-
Machine Fault: A critical sensor on a CNC machine faults.
-
Instantaneous Alert: The PLC immediately triggers a webhook.
-
Chat Dispatch: Within two seconds, a detailed, formatted message appears in the
#maintenance-alertsGoogle Chat space, complete with machine ID, fault code, and a link to its HMI. -
Team-wide Visibility: Every on-duty technician’s phone and desktop buzzes with the notification.
-
One-Click Acknowledgment: The first available technician clicks the “Acknowledge” button in the chat, which updates the original message to “IN PROGRESS” and logs their name and the timestamp.
The result? Our MTTA is no longer measured in minutes; it’s measured in seconds. We’ve established a new benchmark where an acknowledgment time of over 90 seconds is now considered slow. This isn’t just an optimization—it’s the elimination of the entire communication delay bottleneck.
Creating a Transparent Audit Trail for Every Incident
One of the most powerful, albeit initially overlooked, benefits of this system is the creation of an automatic, indisputable audit trail. The old world of radio calls and shoulder taps was ephemeral. There was no persistent record of who was dispatched, when they responded, or when the issue was resolved. This made root cause analysis difficult and performance tracking nearly impossible.
With Google Chat as the backbone, every single maintenance event now generates a rich, permanent record:
-
Timestamped Alerts: Every initial fault notification is logged with a precise timestamp.
-
Clear Accountability: The “Acknowledge” and “Resolve” button clicks are recorded with the user’s name and the exact time of the action.
-
Contextual Data: Technicians can easily add comments, ask questions, or even upload photos and short videos of the issue directly into the message thread. This provides invaluable context for complex problems and serves as a knowledge base for future incidents.
-
Searchable History: Need to know how many times
Error E-451has occurred on Line 3 in the past six months? A simple search in the Google Chat space provides an instant, chronological list of every related incident and its resolution path.
This transparent log transforms reactive maintenance into a data-driven operation. We can now analyze trends, measure individual and team performance, and provide clear, documented evidence for compliance audits without filling out a single extra form.
Real-World Results and Performance Metrics
Talk is cheap; data tells the story. After deploying the automated dispatch system across our primary production lines, we tracked the impact on our core manufacturing metrics. The results validated the entire project.
| Metric | Before Automation | After Automation | Improvement |
| :--- | :--- | :--- | :--- |
| Mean Time to Acknowledge (MTTA) | ~25 minutes | < 60 seconds | > 95% Reduction |
| Mean Time to Repair (MTTR) | Varies by incident | 15-20% Average Reduction | Significant |
| OEE (Critical Lines) | Department Baseline | +3 to 5 points | Substantial Gain |
| Data Logging | Manual & Inconsistent | Automatic & Immutable | 100% Traceability |
The dramatic reduction in MTTA directly shaves time off the start of every repair job, leading to a consistent drop in overall MTTR. While the system doesn’t turn the wrench, it gets the wrench-turner to the problem faster than ever before. This reduction in unplanned downtime is a direct boost to the “Availability” component of our OEE calculation, resulting in a sustained 3-5 point increase on our most critical and previously bottlenecked assets. This is a massive win, unlocking hidden capacity and increasing throughput without a single piece of new production hardware.
Conclusion: Your Path to a Smarter Plant Floor
We’ve journeyed from the familiar chaos of a machine fault to the streamlined efficiency of an automated dispatch. This isn’t just a theoretical exercise; it’s a practical blueprint for modernizing a core industrial process. By bridging the gap between operational technology (OT) on the plant floor and the information technology (IT) ecosystem of the cloud, you unlock a new level of responsiveness and operational intelligence.
Recap: The Power of Integrated Automation
At its heart, the solution we’ve built dismantles the traditional silos that slow down maintenance operations. Let’s quickly revisit the core transformation:
-
From Lag to Live: We replaced manual radio calls and delayed discovery with instant, machine-triggered alerts. The moment a PLC registers a fault, the notification process begins.
-
From Ambiguity to Actionable Context: Instead of a generic “Machine 5 is down,” your team receives rich, contextual messages in Google Chat—complete with machine ID, specific fault codes, and even a direct link to documentation.
-
From Fragile to Resilient: By using Google Pub/Sub as a message broker, we decoupled our plant-floor data source from our cloud-based notification logic. This Architecting an Event-Driven Workspace with PubSub Firebase and Gemini is inherently more scalable and resilient than a monolithic, point-to-point integration.
This system does more than just send messages. It transforms raw machine data into actionable human intelligence, delivered directly to the people who need it, on a platform they already use. The result is a dramatic reduction in Mean Time To Repair (MTTR), less production downtime, and a more empowered maintenance team.
Scale Your Architecture with Expert Guidance
The architecture we’ve outlined is a powerful starting point, but its true value lies in its potential for expansion. Think of it not as a final product, but as the foundational layer of a plant-wide digital nervous system. As you grow comfortable with this initial implementation, consider these next steps to scale your solution:
-
Bidirectional Communication: Enhance your Google Chat App to accept responses. Imagine technicians acknowledging an alert with a button click or even closing out a work order directly from the chat interface, sending data back into your plant systems.
-
CMMS Integration: Forward the fault data not just to Chat, but also to your Computerized Maintenance Management System (CMMS) via its API. This can automatically generate work orders, log maintenance history, and track asset performance without any manual data entry.
-
Advanced Analytics: Archive every fault message in a data warehouse like BigQuery. Over time, you can use tools like Looker Studio to build dashboards that visualize machine uptime, identify recurring faults, and transition from a reactive to a predictive maintenance strategy.
-
Expand Your Data Sources: Don’t stop with PLC faults. Integrate other data sources like SCADA alarms, sensor readings from IIoT devices, or quality control system alerts to create a unified notification and response platform for your entire operation.
Building a robust, secure, and scalable system is a journey. The path from a simple proof-of-concept to a mission-critical enterprise solution requires careful planning around security, error handling, and infrastructure management. Embrace an iterative approach, start with a high-impact problem as we’ve done here, and build upon your successes. Your smarter, more connected plant floor is well within reach.


Stop Doing Manual Work. Scale with AI.
Want to turn these blog concepts into production-ready reality for your team?
Table Of Contents
Portfolios
Related Posts
Quick Links
Legal Stuff