

AI Agent Observability A Scalable Logging Pattern for BigQuery


As autonomous AI agents replace traditional applications, our standard monitoring tools are becoming obsolete. This article explains why a new paradigm of deep observability is essential to manage these complex, non-deterministic systems.

The Challenge of Enterprise AI A Call for True Observability
As we move from deploying isolated AI models to orchestrating fleets of autonomous agents, the very nature of our software systems is changing. These agents, designed to reason, plan, and act upon complex goals, represent a monumental leap beyond traditional applications. But with this power comes a new and urgent challenge: how do we observe, debug, and govern systems that operate with a degree of non-determinism? Standard application performance monitoring (APM) tools, built for a world of predictable stack traces and deterministic logic, fall short. We are entering an era that demands a new paradigm—a call for true, deep observability tailored for the unique complexities of enterprise AI.
Why Autonomous Agents are More Than Just Chatbots
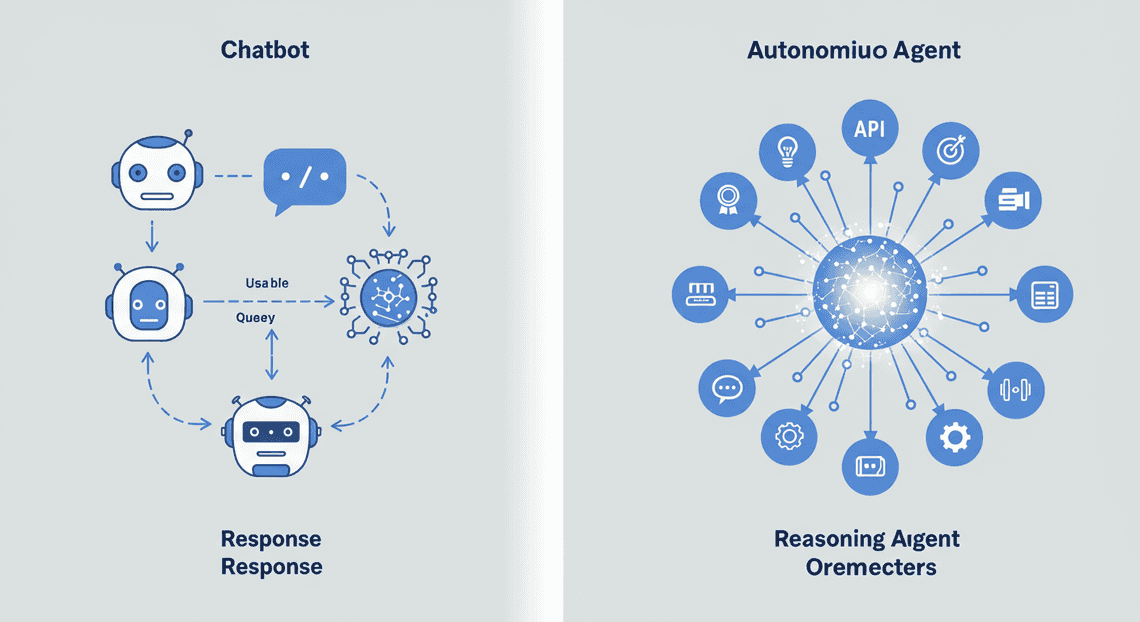
It’s tempting to view Architecting AI Agents for the Google Workspace Marketplace as a simple evolution of the chatbot, but this comparison fundamentally misunderstands their architecture and capability. A traditional chatbot operates on a relatively simple request-response loop. An autonomous agent, however, is a complex, stateful system that executes a dynamic cycle of thought, action, and observation.
Consider the key differentiators:
-
Stateful, Multi-Turn Reasoning: Unlike a stateless chatbot that treats each query independently, an agent maintains context across an entire task. It remembers previous steps, learns from tool outputs, and adjusts its plan dynamically. A single user request like “Summarize our top Q3 deals and email the report to the sales team” can trigger a dozen internal steps.
-
**Dynamic Tool Use: Agents are not confined to a pre-trained knowledge base. They are given tools—APIs, databases, code interpreters, internal microservices—and the autonomy to decide which tool to use, when to use it, and with what parameters to achieve a goal. This introduces a vast surface area of potential integrations and failure points that exist outside the LLM itself.
-
Non-Deterministic Execution Paths: Two identical user prompts given to the same agent might result in slightly different execution paths. The agent’s “thought” process, guided by the probabilistic nature of LLMs, can lead it to call tools in a different order or formulate different intermediate steps. This makes debugging a nightmare; you can’t simply “reproduce the bug” in the way you would with traditional code.
In essence, a chatbot answers a question. An autonomous agent accomplishes a goal, navigating a complex decision tree of LLM calls and tool interactions to get there.
The ‘Black Box’ Dilemma Monitoring Reliability and Cost at Scale
This leap in capability brings with it a significant operational challenge. The core reasoning engine of an agent—the Large Language Model—is an opaque “black box.” We can inspect the inputs (the prompt) and the outputs (the completion), but the intricate path of “why” it made a specific decision remains hidden. When an agent fails, it rarely throws a neat NullPointerException. Instead, it might get stuck in a loop, hallucinate a tool that doesn’t exist, or confidently provide a subtly incorrect answer.
This dilemma manifests in three critical areas at enterprise scale:
-
Reliability: How do you define and measure agent reliability? It’s no longer about simple uptime. We need to track task completion rates, the accuracy of final outputs, and the frequency of “silent failures.” An agent that reports “success” after booking a meeting for the wrong day is more dangerous than one that errors out cleanly. Without detailed tracing, these qualitative failures are invisible until a customer complains.
-
Cost: Every step in an agent’s reasoning loop has a cost. Each LLM call consumes tokens, and each tool use might incur API charges or compute resources. An inefficient agent that takes ten steps to do what could be done in three, or one that gets caught in a retry loop, can cause costs to spiral out of control. Manually inspecting logs to diagnose a high invoice is simply not a scalable solution.
-
Performance: Latency is not just about model inference time. The end-to-end performance of an agent includes the time spent in thought, the latency of every tool it calls, and the overhead of parsing the results. A slow API deep within an agent’s execution chain can bring the entire user experience to a halt, but traditional APM tools won’t pinpoint the LLM’s decision to call that specific tool as the root cause.
Introducing a Data-Driven Pattern for Agent Performance Audits
To tame this complexity, we must shift our mindset from logging strings to structuring events. The solution is not to try and crack open the LLM’s black box, but to meticulously record and structure every observable event around it. We need to treat every agent interaction as a rich, queryable dataset.
This is the core of our data-driven pattern: capturing the agent’s entire execution trace as a series of structured events and loading them into a scalable analytics warehouse like BigQuery. Instead of a flat file of text logs, imagine a collection of relational tables that describe every facet of an agent’s journey:
-
Trace Events: A parent record for each unique task, identified by a
trace_id. -
LLM Call Events: Every prompt sent to and completion received from a model, capturing the model name, token counts, latency, and the raw text.
-
Tool Call Events: Which tool was selected, the input parameters it was given, and whether the execution succeeded or failed.
-
Tool Output Events: The data returned by the tool, which then informs the agent’s next “thought” step.
By structuring our logs this way, we transform observability from a reactive debugging chore into a proactive, analytical discipline. We can now write SQL queries to answer critical business and operational questions:
-
What is the average number of tool calls per successful task? -
Which agent version has the highest rate of task completion? -
Show me all the traces where the final cost exceeded $1.00. -
Which tool is failing most frequently, and what are the common inputs causing the failure?
This approach turns your agent’s operational data into a strategic asset, providing the foundation for true performance audits, cost control, and continuous improvement at enterprise scale.
is a critical component for success in any field. Without it, even the most brilliant strategies can falter, leading to misunderstandings, missed opportunities, and a general decline in morale. It’s the thread that weaves together individual efforts into a cohesive whole, ensuring that every team member is aligned with the overarching goals and understands their specific role in achieving them. This alignment fosters a sense of shared purpose and empowers individuals to make autonomous decisions that still serve the collective good. Therefore, investing time and resources into developing clear and consistent communication channels is not a luxury, but a fundamental necessity for sustainable growth.
Implementation Guide: Building the Logging Pipeline
With the “why” and “what” covered, let’s roll up our sleeves and get to the “how.” This section provides a step-by-step walkthrough for building the logging pipeline, from creating the data’s final destination in BigQuery to integrating the logger into your agent’s code. We’ll be using [AI Powered Cover Letter [Automated Job Creation in Real Time Jobber and Google Sheets Integration from Gmail](https://votuduc.com/Automated-Job-Creation-in-Jobber-from-Gmail-p115606) Engine](https://votuduc.com/AI-Powered-Cover-Letter-Automated Quote Generation and Delivery System for Jobber-Engine-p111092) as a lightweight, serverless middleware to handle authentication and API calls, which is an excellent pattern for rapid prototyping and integration within the Google ecosystem.
Step 1: Configuring Your BigQuery Dataset and Table
Before we can log anything, we need a place to store it. Our first step is to define the structured home for our agent’s operational data in BigQuery.
-
Navigate to BigQuery: Open the Google Cloud Console and navigate to the BigQuery section.
-
Create a Dataset: A dataset is a container for your tables, similar to a schema in a traditional database.
- Click the three dots next to your project ID in the Explorer panel and select “Create dataset.”
Set the* Dataset ID** to something meaningful, like ai_agent_observability.
Choose your desired* Data location**.
- Click “Create dataset.”
- Create the Table: Now, let’s define the schema for our logs. This is the most critical part of this step, as it dictates the structure of our observability data.
- Click the three dots next to the new
ai_agent_observabilitydataset and select “Create table.”
Set the* Table name** to agent_logs.
- Define the schema. You can do this via the UI, but it’s often easier to use the “Edit as text” option and paste a JSON schema. Here is a robust starting schema:
[

{"name": "run_id", "type": "STRING", "mode": "REQUIRED", "description": "Unique identifier for a single, complete agent execution."},

{"name": "timestamp", "type": "TIMESTAMP", "mode": "REQUIRED", "description": "The precise UTC timestamp when the event was logged."},

{"name": "step_id", "type": "INTEGER", "mode": "REQUIRED", "description": "The sequential step number within a single agent run."},

{"name": "event_type", "type": "STRING", "mode": "REQUIRED", "description": "Category of the log event (e.g., THOUGHT, ACTION, OBSERVATION, TOOL_CALL)."},

{"name": "agent_name", "type": "STRING", "mode": "NULLABLE", "description": "Identifier for the specific agent or version being run."},

{"name": "model_name", "type": "STRING", "mode": "NULLABLE", "description": "The underlying LLM used for this step (e.g., gemini-1.5-pro-001)."},

{"name": "prompt", "type": "STRING", "mode": "NULLABLE", "description": "The full prompt sent to the LLM for this step."},

{"name": "response", "type": "STRING", "mode": "NULLABLE", "description": "The raw, unstructured response from the LLM."},

{"name": "parsed_output", "type": "JSON", "mode": "NULLABLE", "description": "Structured data extracted from the LLM response (e.g., a tool call with arguments)."},

{"name": "cost_usd", "type": "FLOAT64", "mode": "NULLABLE", "description": "Estimated token cost for this specific API call in USD."},

{"name": "latency_ms", "type": "INTEGER", "mode": "NULLABLE", "description": "The duration of the LLM call or tool execution in milliseconds."},

{"name": "metadata", "type": "JSON", "mode": "NULLABLE", "description": "A flexible field for any other custom key-value pairs or context."}

]
- Set Partitioning and Clustering: This is crucial for cost and performance at scale.
Under the “Partitioning and clustering” section, set* Partition by field to timestamp. Choose a Time partitioning type** of “Day.” This organizes your data into daily folders, drastically reducing the amount of data scanned (and billed) for time-bound queries.
In the* Cluster by fields** input, add run_id and agent_name. Clustering co-locates data with the same values for these fields, making queries that filter or aggregate by a specific run or agent incredibly fast and cheap.
Alternatively, you can create the entire table using this single SQL statement in the BigQuery query editor:
CREATE TABLE `your-gcp-project-id.ai_agent_observability.agent_logs`

(

run_id STRING NOT NULL OPTIONS(description="Unique identifier for a single, complete agent execution."),

timestamp TIMESTAMP NOT NULL OPTIONS(description="The precise UTC timestamp when the event was logged."),

step_id INT64 NOT NULL OPTIONS(description="The sequential step number within a single agent run."),

event_type STRING NOT NULL OPTIONS(description="Category of the log event (e.g., THOUGHT, ACTION, OBSERVATION, TOOL_CALL)."),

agent_name STRING OPTIONS(description="Identifier for the specific agent or version being run."),

model_name STRING OPTIONS(description="The underlying LLM used for this step (e.g., gemini-1.5-pro-001)."),

prompt STRING OPTIONS(description="The full prompt sent to the LLM for this step."),

response STRING OPTIONS(description="The raw, unstructured response from the LLM."),

parsed_output JSON OPTIONS(description="Structured data extracted from the LLM response (e.g., a tool call with arguments)."),

cost_usd FLOAT64 OPTIONS(description="Estimated token cost for this specific API call in USD."),

latency_ms INT64 OPTIONS(description="The duration of the LLM call or tool execution in milliseconds."),

metadata JSON OPTIONS(description="A flexible field for any other custom key-value pairs or context.")

)

PARTITION BY TIMESTAMP_TRUNC(timestamp, DAY)

CLUSTER BY run_id, agent_name

OPTIONS(

description="Observability logs for AI agent executions."

);
Your destination is now ready.
Step 2: Authenticating Apps Script with GCP via OAuth2
To write data to our BigQuery table, our script needs permission. We’ll use the robust OAuth2 flow to grant our Apps Script project the necessary credentials securely.
-
Create an Apps Script Project: Go to script.google.com and create a new project. Give it a name like “Agent Logger Webhook.”
-
Link to your GCP Project: This is the magic step that connects your script to your cloud resources.
In the Apps Script editor, click the* Project Settings** (gear icon) on the left.
- Scroll down to the “Google Cloud Platform (GCP) Project” section.
Click “Change project” and enter the* Project Number** of the GCP project where you created your BigQuery table. You can find this on the main dashboard of your Google Cloud Console.
- Add the OAuth2 Library: We’ll use a well-maintained open-source library to simplify the OAuth2 flow.
Click the* Libraries** (+) icon on the left sidebar.
- In the “Add a library” field, paste the following script ID:
1B7FSrk57A1B_rTR3628VfLAplTeM9935Nn_SA32v8S1G_Aun1j5cOABd
-
Click “Look up.” Select the latest version and ensure the Identifier is
OAuth2. -
Click “Add.”
- Set up the Authentication Service: Now, add the following code to your
Code.gsfile. This function configures the OAuth2 service, specifying that we need permission to interact with BigQuery.
/**

* Creates and returns an OAuth2 service for BigQuery.

* This function handles the authorization flow. The first time it's run,

* it will prompt the user for permission.

*/

function getBigQueryService() {

const projectId = 'your-gcp-project-id'; // <-- IMPORTANT: Replace with your GCP Project ID

return OAuth2.createService('BigQuery')

// Set the authorization base URL.

.setAuthorizationBaseUrl('https://accounts.google.com/o/oauth2/auth')

// Set the token URL.

.setTokenUrl('https://accounts.google.com/o/oauth2/token')

// Set the client ID and secret from the GCP project.

.setClientId(ScriptApp.getOAuthToken().match(/azp=([^;]+)/)[1])

.setClientSecret('not-a-real-secret') // This is a placeholder for Apps Script

// Set the name of the callback function in the script that should be

// invoked to complete the OAuth flow.

.setCallbackFunction('authCallback')

// Set the property store where authorized tokens should be persisted.

.setPropertyStore(PropertiesService.getUserProperties())

// Set the scopes required by the BigQuery API.

.setScope('https://www.googleapis.com/auth/bigquery')

// Set the GCP project ID for the service.

.setParam('project_id', projectId);

}

/**

* A callback function that is invoked to complete the OAuth flow.

*/

function authCallback(request) {

const bigQueryService = getBigQueryService();

const isAuthorized = bigQueryService.handleCallback(request);

if (isAuthorized) {

return HtmlService.createHtmlOutput('Success! You can close this tab.');

} else {

return HtmlService.createHtmlOutput('Denied. You must grant access to continue.');

}

}
Important: Before proceeding, run the getBigQueryService function once from the Apps Script editor. A dialog will pop up asking you to authorize the script. Go through the flow; this is a one-time step that grants the script the token it needs to act on your behalf.
Step 3: Crafting the Logging Function to Stream Data to the BigQuery API
With authentication handled, we can write the core function. This code will receive log data, format it for the BigQuery Streaming API, and send it off. We’ll use the tabledata.insertAll endpoint, which is designed for high-throughput, real-time data ingestion.
Add the following functions to your Code.gs file:
// --- Configuration ---

const GCP_PROJECT_ID = 'your-gcp-project-id';       // <-- Replace

const BIGQUERY_DATASET_ID = 'ai_agent_observability'; // <-- Replace if you used a different name

const BIGQUERY_TABLE_ID = 'agent_logs';               // <-- Replace if you used a different name

/**

* The main entry point for our Web App. It receives POST requests.

*/

function doPost(e) {

try {

const logEntry = JSON.parse(e.postData.contents);

// Basic validation: ensure required fields are present

if (!logEntry.run_id || !logEntry.timestamp || !logEntry.step_id || !logEntry.event_type) {

throw new Error("Missing required log fields: run_id, timestamp, step_id, event_type.");

}

const result = streamLogToBigQuery(logEntry);

return ContentService.createTextOutput(JSON.stringify({

status: 'success',

response: result

})).setMimeType(ContentService.MimeType.JSON);

} catch (error) {

console.error('Error processing log entry: ' + error.toString());

return ContentService.createTextOutput(JSON.stringify({

status: 'error',

message: error.toString()

})).setMimeType(ContentService.MimeType.JSON);

}

}

/**

* Streams a single log entry object to the configured BigQuery table.

* @param {Object} logEntry The log data to insert.

* @return {Object} The API response from BigQuery.

*/

function streamLogToBigQuery(logEntry) {

const bigQueryService = getBigQueryService();

if (!bigQueryService.hasAccess()) {

throw new Error('Authentication failed. Please re-authorize the script.');

}

const apiUrl = `https://bigquery.googleapis.com/bigquery/v2/projects/${GCP_PROJECT_ID}/datasets/${BIGQUERY_DATASET_ID}/tables/${BIGQUERY_TABLE_ID}/insertAll`;

// The BigQuery API expects rows in a specific format.

const requestBody = {

"rows": [

{

"json": logEntry

}

],

"skipInvalidRows": false,

"ignoreUnknownValues": false

};

const options = {

'method': 'post',

'contentType': 'application/json',

'headers': {

'Authorization': 'Bearer ' + bigQueryService.getAccessToken()

},

'payload': JSON.stringify(requestBody),

'muteHttpExceptions': true // Important for capturing error responses

};

const response = UrlFetchApp.fetch(apiUrl, options);

const responseCode = response.getResponseCode();

const responseBody = response.getContentText();

if (responseCode === 200) {

const parsedResponse = JSON.parse(responseBody);

if (parsedResponse.insertErrors && parsedResponse.insertErrors.length > 0) {

// Handle row-level insertion errors

const errorDetails = JSON.stringify(parsedResponse.insertErrors);

console.error(`BigQuery insertErrors: ${errorDetails}`);

throw new Error(`Failed to insert rows into BigQuery. Details: ${errorDetails}`);

}

console.log('Successfully streamed log to BigQuery.');

return parsedResponse;

} else {

// Handle API-level errors

console.error(`BigQuery API error. Code: ${responseCode}. Response: ${responseBody}`);

throw new Error(`BigQuery API request failed with status ${responseCode}.`);

}

}
This code sets up a doPost(e) function, which is the standard entry point for an Apps Script Web App that accepts POST requests. It parses the incoming JSON, validates it, and passes it to streamLogToBigQuery, which handles the authenticated API call.
Step 4: Integrating the Logger into Your Agent’s Decision Loop
The final piece of the puzzle is to call our new logging endpoint from the AI agent itself. This involves deploying the Apps Script as a web app and then making a simple HTTP request from our agent’s code (we’ll use JSON-to-Video Automated Rendering Engine for this example).
- Deploy the Apps Script:
In the Apps Script editor, click the* Deploy** button in the top right and select “New deployment.”
Click the gear icon next to “Select type” and choose* Web app**.
- Give it a description, like “V1 - Agent Logger.”
For* Execute as**, select Me ([email protected]).
For* Who has access**, select Anyone.
- Security Note: This creates a public URL. For production, you should implement a security layer, such as checking for a secret token in the request header inside your
doPostfunction. For this guide, we’ll keep it simple.
Click* Deploy**. Copy the Web app URL provided. You’ll need it in your agent code.
- Integrate with a Python Agent:
Now, in your Python agent’s environment, you can create a simple logger class that sends data to this URL.
import requests

import uuid

import time

from datetime import datetime, timezone

class BigQueryLogger:

"""A logger that sends agent observability data to a [Genesis Engine AI Powered Content to Video Production Pipeline](https://votuduc.com/Genesis-Engine-AI-Powered-Content-to-Video-Production-Pipeline-p452744) webhook."""

def __init__(self, webhook_url: str, agent_name: str):

if not webhook_url:

raise ValueError("Webhook URL cannot be empty.")

self.webhook_url = webhook_url

self.agent_name = agent_name

self.run_id = str(uuid.uuid4())

self.step_id = 0

print(f"Logger initialized for run_id: {self.run_id}")

def log(self, event_type: str, data: dict):

"""

Constructs a log payload and sends it to the webhook.

Args:

event_type: The type of event (e.g., 'THOUGHT', 'ACTION').

data: A dictionary containing event-specific data.

"""

self.step_id += 1

payload = {

"run_id": self.run_id,

"timestamp": datetime.now(timezone.utc).isoformat(),

"step_id": self.step_id,

"event_type": event_type.upper(),

"agent_name": self.agent_name,

**data # Unpack the rest of the data into the payload

}

try:

response = requests.post(self.webhook_url, json=payload, timeout=10)

response.raise_for_status() # Raises an exception for 4xx/5xx errors

# print(f"Step {self.step_id}: Successfully logged event '{event_type}'.")

except requests.exceptions.RequestException as e:

print(f"Error logging event to BigQuery: {e}")

# --- Example Usage in an Agent's Decision Loop ---

# 1. Initialize the logger at the start of your agent's run

WEBHOOK_URL = "YOUR_APPS_SCRIPT_WEB_APP_URL" # <-- Paste your URL here!

logger = BigQueryLogger(webhook_url=WEBHOOK_URL, agent_name="research_analyst_v1")

# 2. Inside your agent's loop, call the log method at each step

def run_agent(user_query):

# --- Step: Thought ---

start_time = time.time()

prompt = f"The user wants to know: {user_query}. How should I approach this?"

# response_from_llm = llm.invoke(prompt) # Pretend LLM call

response_from_llm = "I should use the 'search_web' tool to find recent articles."

latency_ms = int((time.time() - start_time) * 1000)

logger.log("THOUGHT", {

"model_name": "gemini-1.5-pro-001",

"prompt": prompt,

"response": response_from_llm,

"latency_ms": latency_ms,

"cost_usd": 0.0012 # Estimated cost

})

# --- Step: Action (Tool Call) ---

parsed_tool_call = {"tool_name": "search_web", "arguments": {"query": "AI agent observability"}}

logger.log("TOOL_CALL", {

"parsed_output": parsed_tool_call

})

# --- Step: Observation (Tool Output) ---

# tool_output = search_web(query="AI agent observability") # Pretend tool execution

tool_output = "Found 3 articles about logging patterns for AI agents..."

logger.log("OBSERVATION", {

"response": tool_output,

"metadata": {"source": "search_web_tool"}

})

# ... continue loop until final answer ...

# --- Run the agent ---

run_agent("What are the best practices for AI agent observability?")
And that’s it! Your agent is now streaming structured logs directly into a scalable, queryable BigQuery table with every step it takes. You have successfully decoupled your logging mechanism from your agent’s core logic, enabling a powerful observability foundation.
From Raw Data to Actionable Insights: Querying Your Audit Log
Storing structured logs is only half the battle; the real value emerges when you start asking questions of your data. With our agent interactions neatly cataloged in BigQuery, we can move from passive data collection to active, insight-driven analysis. The JSON structure we defined becomes a powerful, queryable schema that allows us to dissect agent behavior with precision. Let’s explore how to transform these raw logs into critical business and operational intelligence.
Analyzing Performance: Identifying High-Latency or Low-Confidence Decisions
Performance is paramount, especially for user-facing agents. A slow or unreliable agent creates a frustrating user experience and can undermine trust in your system. Our audit log is the ground truth for measuring this performance.
Latency is more than just an average response time. While a mean value is a good starting point, it can be skewed by a few fast responses, hiding the painful experience of users who hit outliers. A better approach is to analyze latency distribution using percentiles (like p95 and p99) to understand the “worst-case” experience. We can query the metadata.duration_ms field to identify which specific agents, tools, or steps are the primary bottlenecks in your system. Is a particular API call consistently slow? Does a complex reasoning step take too long? These are the questions your logs can now answer.
Confidence is a more nuanced metric. An agent might produce a result quickly but with low confidence, leading to incorrect outcomes or a need for retries. We can infer low confidence by querying for specific patterns:
-
High Retry Counts: Querying for steps where
step.retry_countis greater than zero points directly to interactions where the agent struggled. -
Error Patterns: Analyzing logs where
step.statusis ‘FAILURE’ and grouping bystep.error_messageortool.namecan reveal brittle integrations or misunderstood tool instructions. -
Fallback Usage: If you have a “fallback” tool for when other tools fail, a high invocation rate for this tool is a strong indicator of systemic low-confidence decisions.
By actively monitoring these metrics, you can proactively identify and address performance degradation before it significantly impacts users.
Auditing Costs: Tracking Token Consumption per Agent or Task
LLM-powered agents are powerful but can be expensive. Every call to a model consumes tokens, and these costs can accumulate rapidly, especially at scale. Effective cost management requires granular visibility into where every token is being spent.
Our logging pattern, which captures llm.usage details for every model interaction, provides exactly this visibility. You can write simple aggregation queries to:
-
Calculate Total Cost: Sum the
llm.usage.total_tokensacross your entire system for a given period. By joining this with a price table (e.g.,$0.002 / 1K tokens), you can get a precise dollar value. -
Attribute Costs: Group token consumption by
agent.name,task_id, or even the enduser_id. This allows you to identify your most expensive agents, understand the cost of specific features, or implement per-user cost controls. -
Optimize Model Usage: By grouping by
llm.model_name, you can compare the cost-effectiveness of different models for similar tasks. You might discover that a smaller, cheaper model performs just as well for certain agents, presenting a clear opportunity for optimization.
This level of financial auditing is non-negotiable for production systems. It transforms your LLM expenditure from an opaque operational cost into a well-understood, optimizable metric.
Visualizing Agent Behavior with Looker Studio Dashboards
While SQL queries are perfect for deep-dive analysis, dashboards provide the high-level, at-a-glance overview needed for continuous monitoring and stakeholder reporting. Google’s Looker Studio is an excellent choice for this, as it connects natively to BigQuery and offers a powerful, free visualization platform.
Connecting your audit_logs table as a data source in Looker Studio, you can build a comprehensive observability dashboard. Consider including these key components:
-
Key Performance Indicators (KPIs): Use scorecard charts to display critical metrics like “Total Cost (Last 24h)”, “P95 Latency (ms)”, “Error Rate (%)”, and “Total Agent Invocations”.
-
Time Series Analysis: Plot metrics like average latency, token consumption, and error counts over time to spot trends, anomalies, or the impact of a new deployment.
-
Tool & Agent Breakdown: Use bar or pie charts to visualize the most frequently used (or most error-prone) tools and agents. This helps focus your optimization efforts.
-
Cost Analysis Table: Create a table that lists agents or tasks ordered by their total token consumption, making it easy to spot the most expensive operations.
-
Interactive Filters: Add controls to filter the entire dashboard by
agent.name,llm.model_name, or a specific date range, allowing for interactive exploration by your team.
A well-designed dashboard democratizes your agent data, making it accessible and actionable for engineers, product managers, and business leaders alike.
Example SQL Queries for Common Performance Audits
Let’s put theory into practice. Here are four essential BigQuery SQL queries you can adapt to start auditing your agent’s performance. These examples assume your data is in a table named your_project.agent_observability.audit_logs.
1. P95 Latency per Tool
This query identifies the 95th percentile latency for each tool your agents use, helping you pinpoint the slowest interactions that impact user experience.
-- Find the "worst-case" latency for each tool used by agents.

-- P95 is a great metric to understand user-impacting slowness.

SELECT

JSON_VALUE(log_entry, '$.tool.name') AS tool_name,

APPROX_QUANTILES(CAST(JSON_VALUE(log_entry, '$.metadata.duration_ms') AS INT64), 100)[OFFSET(95)] AS p95_latency_ms

FROM

`your_project.agent_observability.audit_logs`

WHERE

-- Only include logs that represent a tool call

JSON_VALUE(log_entry, '$.type') = 'TOOL_STEP'

GROUP BY

tool_name

ORDER BY

p95_latency_ms DESC;
2. Daily Token Cost by Agent and Model
This query provides a daily breakdown of token consumption and estimated cost, grouped by the agent and the specific LLM model used.
-- Calculate daily token usage and estimated cost, broken down by agent and model.

-- NOTE: Replace the cost values with the actual pricing for your models.

WITH model_costs AS (

SELECT 'claude-3-opus-20240229' as model, 0.015 / 1000 AS prompt_cost, 0.075 / 1000 AS completion_cost UNION ALL

SELECT 'gpt-4-turbo' as model, 0.01 / 1000 AS prompt_cost, 0.03 / 1000 AS completion_cost

)

SELECT

DATE(timestamp) AS usage_date,

JSON_VALUE(log_entry, '$.agent.name') AS agent_name,

JSON_VALUE(log_entry, '$.llm.model_name') AS model_name,

SUM(CAST(JSON_VALUE(log_entry, '$.llm.usage.prompt_tokens') AS INT64)) AS total_prompt_tokens,

SUM(CAST(JSON_VALUE(log_entry, '$.llm.usage.completion_tokens') AS INT64)) AS total_completion_tokens,

SUM(

CAST(JSON_VALUE(log_entry, '$.llm.usage.prompt_tokens') AS INT64) * mc.prompt_cost +

CAST(JSON_VALUE(log_entry, '$.llm.usage.completion_tokens') AS INT64) * mc.completion_cost

) AS estimated_cost_usd

FROM

`your_project.agent_observability.audit_logs` l

LEFT JOIN model_costs mc ON JSON_VALUE(l.log_entry, '$.llm.model_name') = mc.model

WHERE

-- Only include logs that have LLM usage data

JSON_QUERY(log_entry, '$.llm.usage') IS NOT NULL

GROUP BY

usage_date,

agent_name,

model_name

ORDER BY

usage_date DESC,

estimated_cost_usd DESC;
3. Identifying Most Frequently Failing Tools
This query is essential for debugging. It counts failures for each tool, helping you prioritize which integrations need to be hardened.
-- Find which tools are failing most often to guide debugging efforts.

SELECT

JSON_VALUE(log_entry, '$.tool.name') AS tool_name,

COUNT(*) AS failure_count,

-- Get a sample of recent error messages for this tool

ARRAY_AGG(

JSON_VALUE(log_entry, '$.step.error_message') IGNORE NULLS LIMIT 5

) AS sample_error_messages

FROM

`your_project.agent_observability.audit_logs`

WHERE

JSON_VALUE(log_entry, '$.step.status') = 'FAILURE'

AND JSON_VALUE(log_entry, '$.type') = 'TOOL_STEP'

GROUP BY

tool_name

ORDER BY

failure_count DESC;
4. Tracing a Single Task’s Journey
When you need to debug a specific user interaction, this query reconstructs the entire sequence of events for a single task_id.
-- Reconstruct the full step-by-step journey for a single agent task.

-- This is invaluable for deep-dive debugging of a specific interaction.

SELECT

timestamp,

JSON_VALUE(log_entry, '$.type') AS step_type,

JSON_VALUE(log_entry, '$.metadata.step_index') AS step_index,

-- Use JSON_QUERY to extract the JSON object for thought, tool, etc.

JSON_QUERY(log_entry, '$.step.thought') AS thought,

JSON_QUERY(log_entry, '$.tool') AS tool_details,

JSON_QUERY(log_entry, '$.step.observation') AS observation,

JSON_VALUE(log_entry, '$.metadata.duration_ms') AS duration_ms,

JSON_VALUE(log_entry, '$.step.status') AS status

FROM

`your_project.agent_observability.audit_logs`

WHERE

JSON_VALUE(log_entry, '$.task_id') = 'YOUR_SPECIFIC_TASK_ID' -- Replace with the ID you're debugging

ORDER BY

timestamp ASC;
Scaling for the Enterprise: From a Pattern to a Platform
The initial logging pattern provides immediate value, capturing crucial interactions and performance metrics. However, as your AI agent’s usage grows from hundreds to millions of interactions per day, the initial architecture will begin to show its limits. Scaling isn’t just about handling more data; it’s about building a robust, secure, and intelligent observability platform. This involves graduating from simple scripts to a decoupled, Architecting an Event-Driven Workspace with PubSub Firebase and Gemini, implementing stringent data governance, and leveraging the collected data to create automated feedback loops that drive continuous improvement.
Handling High Throughput: When to Graduate from Apps Script to Cloud Functions or Pub/Sub
An Apps Script webhook is a fantastic, low-friction way to start. It’s perfect for proofs-of-concept or low-volume internal tools. But when your agent goes primetime, you’ll hit the inherent limitations of the Apps Script environment: execution time quotas, concurrent execution limits, and trigger rate-limiting. These constraints can lead to dropped logs, increased latency, and a system that is fundamentally unreliable at scale.
The First Step: Cloud Functions
The most direct upgrade path is to replace the Apps Script endpoint with an HTTP-triggered Cloud Function. This is your first step into a true serverless architecture.
-
Why it’s better: Cloud Functions are designed for high-throughput, ephemeral workloads. They automatically scale based on incoming traffic, from zero to thousands of concurrent executions. You escape the restrictive quotas of Apps Script and gain a more professional development environment with better dependency management and integration with Cloud Logging and Monitoring.
-
The Pattern: Your AI agent simply makes an HTTP POST request to the Cloud Function’s trigger URL. The function’s code receives the log payload, performs any necessary validation or light transformation, and uses the BigQuery Storage Write API to stream the data directly into your target table. This API is optimized for high-throughput, low-latency ingestion, making it a perfect fit.
The Enterprise Leap: Decoupling with Pub/Sub
While Cloud Functions solve the immediate scaling problem, they still represent a tightly coupled system. Your agent’s code is directly calling the logging endpoint. If that endpoint is down or slow, the agent’s performance could be impacted. For maximum resilience and flexibility, you need to introduce a messaging queue like Pub/Sub.
-
Why it’s essential: Pub/Sub decouples your log producers (the AI agents) from your log consumers (the ingestion service). The agent’s only job is to publish a message to a Pub/Sub topic—a fast, asynchronous, “fire-and-forget” operation.
-
The Architecture:
-
Producer: Your AI agent publishes the log event as a message to a Pub/Sub topic.
-
Topic: Pub/Sub acts as a durable, scalable buffer. If the downstream services are unavailable, Pub/Sub retains the messages until they can be processed, effectively preventing data loss.
-
Subscriber: A separate service, typically a Pub/Sub-triggered Cloud Function or a Dataflow pipeline, subscribes to the topic. When a message arrives, it triggers the subscriber, which then processes the log and writes it to BigQuery.
This architecture is incredibly robust. It also enables a “fan-out” pattern where a single log event can be sent to multiple destinations simultaneously. For example, the same log message could trigger a Cloud Function to write to BigQuery, another to update a real-time monitoring dashboard, and a third to archive the raw log in Cloud Storage.
Data Governance and Security for Sensitive AI Interaction Logs
As you log more interactions, you will inevitably capture sensitive data—personally identifiable information (PII), confidential business details, or proprietary user queries. Simply dumping this raw data into BigQuery is a significant security and compliance risk. An enterprise-grade platform must have data governance baked in from the start.
Sanitize at Ingestion with Cloud DLP
The best practice is to de-identify data before it ever lands in your analytical warehouse. The Cloud Data Loss Prevention (DLP) API is the perfect tool for this. By integrating it into your ingestion pipeline (e.g., within your Cloud Function or Dataflow job), you can automatically inspect and redact sensitive information.
For example, your Cloud Function can receive the raw log from Pub/Sub, pass the user_prompt and agent_response fields to the DLP API to mask email addresses, names, and financial data, and then write the sanitized record to BigQuery. You can even store the “tombstone” of the redacted data, allowing for re-identification by highly privileged processes if ever required for an audit.
Control Access in BigQuery
Once the data is in BigQuery, you need fine-grained control over who can see what. Relying on simple project-level or dataset-level permissions is insufficient.
-
Column-Level Security: Not all data consumers need to see everything. You can use policy tags to restrict access to specific columns. For instance, your data science team might have access to the full, sanitized
user_prompt, while a business analyst might only be able to see token counts and latency metrics. -
Row-Level Security: You can create policies that filter which rows a user can see. A product manager for “Agent A” could be granted access only to the logs where the
agent_idcolumn is ‘A’, ensuring they cannot view data from other teams’ agents. -
Authorized Views: A powerful technique is to create an Authorized View that pre-aggregates or filters the data from the base table. You then grant users access to this view, not the underlying table. This allows you to expose insights (e.g., daily average sentiment score) without ever exposing the raw, row-level data.
The Future: Proactive Anomaly Detection and Automated Feedback Loops
With a scalable ingestion pipeline and strong governance in place, your BigQuery dataset transforms from a simple log archive into a strategic asset. The ultimate goal is to move from reactive analysis (querying what happened yesterday) to proactive, automated action.
From Dashboards to Proactive Anomaly Detection
The structured, historical data in BigQuery is the perfect training ground for machine learning models. Using BigQuery ML (BQML), you can build, train, and deploy models directly within your data warehouse using familiar SQL syntax.
Imagine training models to automatically detect:
-
Performance Regressions: A BQML anomaly detection model flags a sudden 20% increase in average tool-call latency for a specific agent version.
-
Semantic Drift: A topic model identifies a new cluster of user prompts that your agent is consistently failing to handle, indicating an emerging, unmet user need.
-
Prompt Injection Attempts: A classification model trained on known attack patterns flags suspicious user inputs in near-real-time.
When these models detect an anomaly, they can insert a finding into an alert table, which in turn triggers a Cloud Function to send a notification to Slack or PagerDuty, alerting the right team before the issue becomes widespread.
Closing the Loop: Automated Fine-Tuning and Self-Healing
This is the pinnacle of AI agent observability: creating automated systems that use insights from logs to improve the agent itself. This closes the loop between observation, analysis, and action.
-
Automated Feedback for Fine-Tuning: The system that detects clusters of poorly handled prompts doesn’t just send an alert. It can trigger a workflow that automatically exports these “hard negative” examples to a [Building Self Correcting Agentic Workflows with Building Self-Correcting Agentic Workflows with Vertex AI](https://votuduc.com/building-self-correcting-agentic-workflows-with-vertex-ai-p-20260321542526) Dataset. A human-in-the-loop can quickly review and approve them, kicking off an automated fine-tuning job on the agent’s base model. Your agent literally learns from its mistakes, with minimal human intervention.
-
Self-Healing Systems: The anomaly detection model that flags a failing external API used by an agent tool doesn’t just alert an engineer. It could trigger a Cloud Function that temporarily disables that specific tool within the agent’s configuration, routing users to a fallback response while automatically creating a high-priority incident ticket.
By evolving your logging pattern into a platform, you create a powerful flywheel. More usage generates more data, which fuels more intelligent models, which drive automated improvements, which leads to a better, more reliable agent. This is how you build and maintain AI systems that can truly operate at enterprise scale.
Conclusion: Building Accountable AI Systems
We’ve journeyed from the conceptual challenge of AI agent observability to a concrete, scalable logging pattern using Google BigQuery. As these autonomous systems move from novel experiments to core components of our products and operations, our approach to monitoring them must evolve. Simply tracking errors and latency is no longer sufficient. We must demand a deeper level of transparency that allows us to understand not just what an agent did, but why it did it. The structured, event-driven audit log we’ve designed is more than a debugging tool; it’s a foundational pillar for building AI systems that are reliable, secure, and ultimately, accountable to their creators and users.
Recap: The Strategic Value of a Centralized AI Audit Log
Adopting the BigQuery logging pattern isn’t merely a technical upgrade; it’s a strategic investment in the trustworthiness of your AI infrastructure. Let’s distill its core value propositions:
-
From Black Box to Glass Box: This pattern transforms the opaque, often non-deterministic reasoning process of an AI agent into a queryable, chronological narrative. By capturing every thought, tool invocation, observation, and final decision in a structured format, you gain an unprecedented ability to debug complex failures, trace unexpected outcomes, and reconstruct the exact “chain of thought” that led to a specific result.
-
Scalability by Design: AI agents are chatty. A single complex task can generate hundreds of log events. By leveraging BigQuery, a serverless, petabyte-scale data warehouse, you completely offload the challenges of scaling your logging infrastructure. Its native support for semi-structured JSON and its powerful SQL engine mean you can ingest massive volumes of data effortlessly and run complex analytical queries to uncover trends, without ever worrying about provisioning servers or managing indexes.
-
A Foundation for Governance and Optimization: A comprehensive audit log is the single source of truth for AI governance. It enables you to answer critical business and operational questions with certainty: Which tools are being used most often? How much is a specific agent’s task costing in LLM tokens and API calls? Is the agent accessing sensitive data appropriately? This data is invaluable for cost optimization, performance tuning, security audits, and demonstrating compliance.
Your Next Steps Towards Implementing Robust AI Observability
Theory is valuable, but execution is what matters. Moving from concept to a production-ready observability system is an iterative process. Here’s how you can get started:
-
Start with a Core Implementation: You don’t need to log every conceivable event from day one. Begin by instrumenting your agent framework to capture the most critical events:
AgentRunStart,AgentRunEnd,ToolCall, andToolOutput. Focus on a single, high-value agent to prove the pattern’s effectiveness and build momentum. The schema is designed to be extensible, so you can easily add more granular events later. -
Integrate Logging Deeply: Make observability a first-class citizen in your agent’s code. Use decorators, context managers, or middleware to wrap your tool executions and LLM calls. The goal is to make logging an automatic, non-negotiable part of the agent’s lifecycle. The less manual effort required from developers to add logging, the more consistent and comprehensive your audit trail will be.
-
Visualize and Alert on Key Metrics: A log table full of data is only useful if you can extract insights from it. Connect BigQuery to a BI tool like Looker Studio or Tableau to build dashboards that track key performance indicators (KPIs):
-
Cost: Total token consumption per agent, per task, or per day.
-
Performance: Average task duration and tool execution latency.
-
Reliability: Tool error rates and agent failure rates.
-
Behavior: Most frequently used tools and common failure patterns.
Furthermore, configure alerts on top of your logs to proactively notify you of anomalies, such as a sudden spike in costs, a critical tool that starts failing consistently, or an agent that gets stuck in a loop.
- Socialize the Insights: The value of this data extends far beyond the engineering team. Share your dashboards with product managers to help them understand how users are interacting with AI features. Provide cost and usage reports to finance and leadership. A culture of transparency, backed by empirical data, is the best way to build organizational trust in the autonomous systems you are creating.


Stop Doing Manual Work. Scale with AI.
Want to turn these blog concepts into production-ready reality for your team?
Table Of Contents
Portfolios
Related Posts
Quick Links
Legal Stuff