

Building a Clinical Trial Monitor with Google Chat and BigQuery


Despite a flood of data, a critical time lag in clinical trials often leaves study teams blind to emerging risks. Discover the core obstacles preventing the real-time visibility needed to protect patients and ensure trial integrity.

The Challenge of Real-Time Visibility in Clinical Trials
In the high-stakes world of clinical research, time is not just money—it’s a critical component of trial integrity and patient safety. The ability to monitor progress, identify bottlenecks, and make informed decisions hinges on access to timely, accurate data. Yet, despite the digital transformation sweeping through the life sciences industry, achieving true real-time visibility remains a persistent and formidable challenge. The modern clinical trial generates a deluge of data from disparate sources, but this wealth of information often creates a paradox: we are data-rich but insight-poor. The lag between an event occurring at a clinical site and the relevant data reaching a decision-maker can obscure emerging risks and delay crucial interventions. This section unpacks the core obstacles that prevent study teams from having their finger on the pulse of their trials.
Information Silos and Data Latency in Research
The operational landscape of a clinical trial is inherently fragmented. Data is captured and managed across a constellation of specialized systems, each serving a distinct purpose. This ecosystem typically includes:
-
Electronic Data Capture (EDC): The primary repository for clinical data entered at investigative sites.
-
Clinical Trial Management System (CTMS): Tracks operational aspects like site activation, monitoring visits, and milestone payments.
-
Interactive Response Technology (IRT/IVRS/IWRS): Manages patient randomization and drug supply logistics.
-
Central Lab Portals: House biomarker and safety lab results.
-
ePRO/eCOA Systems: Collect data directly from patients via electronic diaries and questionnaires.
Each of these platforms often exists as an information silo, managed by different vendors or internal departments with its own database schema and access protocols.
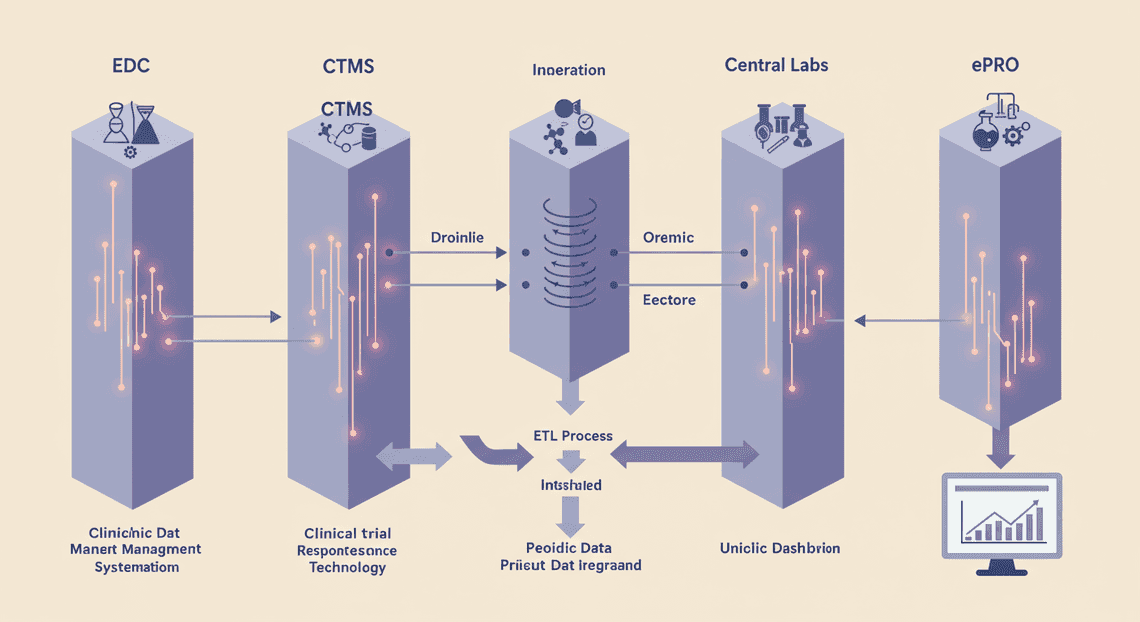
This process introduces significant data latency, the delay between an event and its visibility in a reporting environment. A patient might be screened at a site on Monday morning, but the corresponding data may not be entered into the EDC until Tuesday, processed by the nightly ETL job, and finally appear in a report on Wednesday. This 24-48 hour (or longer) delay means that by the time a project manager reviews a weekly status report, the information is already history, not a reflection of the current reality.
Limitations of Traditional Dashboards and Reporting
The default solution for visualizing trial data has long been the dashboard. Tools like Tableau, Power BI, and Spotfire have become staples for clinical operations teams, providing a graphical overview of Key Performance Indicators (KPIs). While powerful, this traditional approach has inherent limitations in the context of dynamic trial management:
-
Static and Prescriptive: Dashboards are designed to answer pre-defined questions. They display the metrics someone anticipated would be important during the system’s design phase. When an unexpected issue arises or a novel question emerges, the dashboard often lacks the flexibility to provide an immediate answer. Answering a new question typically requires a formal change request to a data analytics team, initiating a cycle that can take days or weeks.
-
High-Friction Access: Accessing a dashboard is rarely a seamless experience. It often involves logging into a corporate network via VPN, navigating to a specific portal, applying multiple filters, and waiting for complex queries to render. This friction is a significant barrier for stakeholders who need quick updates while on the go, such as a Clinical Research Associate (CRA) between site visits or an executive in a leadership meeting.
-
Information Overload: A well-intentioned dashboard can easily become a wall of charts and numbers, forcing the user to hunt for the signal in the noise. This “pull” model of information retrieval places the cognitive burden on the end-user to not only find the right data but also to interpret its significance correctly. Important trends can be missed simply because they are buried in a sea of non-critical metrics.
The Need for On-Demand Enrollment Metrics
Of all the metrics in a clinical trial, enrollment is arguably the most critical and time-sensitive. The rate of patient recruitment is the primary driver of the study timeline, and any deviation from the plan has a direct and significant impact on budget and delivery milestones. Study teams live and breathe enrollment numbers, constantly tracking progress against projections.
The limitations of traditional systems are most acute here. A project manager doesn’t just need a weekly report; they need the ability to get answers on-demand to specific, contextual questions that arise throughout the day:
-
“How many patients did we screen across all US sites this week?”
-
“What is the current screen failure rate for Site 101?”
-
“Which country is closest to hitting its enrollment target?”
Answering these questions shouldn’t require logging into a complex BI tool or exporting a CSV file to manipulate in Excel. The need is for a conversational, low-friction interface that allows stakeholders to query trial data as easily as they would ask a colleague a question. This shifts the paradigm from a static, “pull-based” reporting model to a dynamic, “push and on-demand” interaction, where critical alerts are sent proactively and specific queries are answered in seconds, not hours or days.
Solution Overview A Conversational Interface for Trial Data
The core challenge in managing clinical trials isn’t just collecting data; it’s making that data accessible and actionable for the teams who need it most. Traditionally, accessing up-to-the-minute enrollment figures from a data warehouse like BigQuery requires specialized tools, SQL knowledge, or waiting for a data analyst to run a report. This latency creates a disconnect between the data and the operational decisions that depend on it.
Our solution bridges this gap by bringing the data warehouse directly into the collaborative environment where teams are already working: Google Chat. We will build a custom Chat bot that acts as a conversational front-end to BigQuery. This approach transforms data retrieval from a formal, asynchronous request process into a simple, synchronous command. By embedding data access within the natural flow of conversation, we empower stakeholders to get critical information on demand, fostering a more data-driven and agile trial management process.
Introducing the Google Chat Slash Command for BigQuery
The primary interaction mechanism for our solution is a Google Chat slash command. A slash command is a user-invoked instruction, prefixed with a forward slash (/), that triggers a specific action from a Chat bot. For our purposes, we will define a command like /trial-status that serves as the entry point for all data queries.
When a user types this command, Google Chat sends a secure HTTP request containing the command and its parameters to a pre-configured endpoint. This endpoint is a serverless Google Cloud Function, which acts as the central orchestrator. The Cloud Function is responsible for:
-
Receiving and parsing the incoming request from Google Chat.
-
Validating the user’s permissions and the command’s syntax.
-
Authenticating with Google Cloud services using appropriate service accounts.
-
Constructing and executing a secure, parameterized SQL query against our BigQuery clinical trial dataset.
-
Formatting the query results into a user-friendly response.
-
Sending the formatted response back to the Google Chat space.
This serverless architecture is highly efficient, scalable, and cost-effective, as we only incur costs when the function is actively processing a request.
Core Functionality Querying Enrollment Data Instantly
The initial and most critical function of our bot is to provide immediate updates on subject enrollment, a key performance indicator for any clinical trial. The user interaction is designed to be simple and intuitive. A Research Data Lead, for example, can query a specific study by typing a command directly into their team’s Chat space:
/trial-status study_id=NCT01234567
Upon receiving this command, the backend Cloud Function extracts the study_id parameter. It then uses this identifier to execute a pre-defined, parameterized query against the relevant BigQuery table. This use of parameterized queries is crucial for security, as it completely mitigates the risk of SQL injection attacks.
The query might aggregate data to answer fundamental questions:
-
What is the total number of subjects enrolled?
-
How many subjects have been screened versus randomized?
-
What is the enrollment breakdown per clinical site?
-
How does the current enrollment rate compare to our projections?
BigQuery’s powerful processing engine returns the results in milliseconds. The Cloud Function then takes this raw data and prepares it for presentation, ensuring the user gets a near-real-time snapshot of the trial’s status without ever leaving their chat window.
The End-User Experience for Research Data Leads
Let’s consider the workflow for our target user: a Research Data Lead responsible for monitoring several ongoing trials. Previously, getting a daily status update involved logging into a separate BI dashboard, navigating to the correct report, or sending an email to a data analyst and waiting for a response.
With this new conversational interface, the process is radically simplified. While discussing trial logistics with their team in a Google Chat space, they can simply invoke the bot:
User Input:
/trial-status study_id=NCT01234567
Instead of a raw data dump, the bot responds with a visually organized and easy-to-digest Google Chat Card. This card presents the key metrics in a structured format, allowing for quick comprehension and immediate discussion.
Conceptual Bot Response (as a Google Chat Card):
**Enrollment Status: Study NCT01234567**

*Data as of: 2023-10-27 10:15 AM UTC*

**Overall Enrollment**

- **Total Screened:** 152

- **Total Enrolled:** 85 / 200 (42.5%)

**Enrollment Rate (Last 30 Days)**

- **Average:** 1.5 subjects/day

**Top 5 Enrolling Sites**

1.  **Site US-001:** 22 subjects

2.  **Site DE-004:** 18 subjects

3.  **Site UK-002:** 15 subjects

4.  **Site US-003:** 11 subjects

5.  **Site JP-001:** 8 subjects
This experience provides three distinct advantages for the end-user:
-
Self-Service: It empowers non-technical users to fetch their own data without dependencies.
-
Contextual: The data is delivered directly into the conversational context where it’s most relevant.
-
Actionable: The team can view the numbers, identify trends (e.g., “Site US-003 is falling behind”), and make decisions in a single, fluid workflow.
Architectural Blueprint: System Components and Data Flow
To build a robust and scalable monitoring tool, we need a clear architectural plan. Our system is designed around a decoupled, event-driven model, leveraging the strengths of several Google Cloud services. Each component has a distinct role, and together they create a seamless flow of information from the user’s query to the final, data-rich response. This separation of concerns not only makes the system easier to develop and maintain but also ensures it can scale efficiently as data volumes and user requests grow.
Let’s break down the core components and trace the journey of data through the system.
Google Chat App: The User Interface
The entire user experience is anchored within Google Chat. We aren’t building a separate web or mobile application; instead, we are meeting users where they already collaborate. The Google Chat App serves as the conversational front-end, the primary interface for all interactions.
-
Function: It captures user input through slash commands (e.g.,
/trial-status NCT12345) and interactive card elements (buttons, menus). -
Mechanism: When a user interacts with the app, the Google Chat API generates a JSON event payload. This event, containing details about the user, the chat space, and the specific command or action, is securely sent to our backend application via an HTTP POST request to a pre-configured webhook.
-
Advantage: This approach provides a zero-friction experience. There is no new software for users to install or learn. The interface is intuitive, accessible on both desktop and mobile, and deeply integrated into the collaborative workflow of [Automatically create new folders in Google Drive, generate templates in new folders, fill out text automatically in new files, and save info in [Automated Web Scraping with [Multilingual Text-to-Speech Tool with SocialSheet Streamline Your Social Media Posting 123](https://votuduc.com/Multilingual-Text-to-Speech-Tool-with-Google-Workspace-p809282)](https://votuduc.com/Automated-Web-Scraping-with-Google-Sheets-p292968)](https://workspace.google.com/marketplace/app/auto_create_folder_and_files/430076014869).
Workspace MCP Server: The Application Logic and Orchestration Hub
This is the brain of our operation. The “Workspace Master Control Program” (MCP) is a backend service—we’ll deploy it as a serverless Cloud Run application—that listens for events from the Google Chat App and orchestrates the entire workflow.
-
Function: It acts as the central hub for all application logic.
-
Responsibilities:
-
Event Ingestion: Receives and validates incoming JSON payloads from the Google Chat API.
-
Intent Parsing: Analyzes the payload to understand the user’s request—what command was issued and with what parameters.
-
Query Construction: Translates the user’s intent into a precise, secure, and optimized Standard SQL query. This is a critical step that prevents ad-hoc, potentially malicious queries from ever reaching the database.
-
Data Fetching: Executes the generated SQL query against our BigQuery data warehouse using the BigQuery client libraries.
-
Response Formatting: Processes the raw tabular data returned from BigQuery and transforms it into a rich, human-readable format using Google Chat’s Card V2 message components.
-
API Response: Sends the formatted card message back to the Google Chat API, which then renders it for the user.
BigQuery: The Scalable Data Warehouse for Trial Tables
BigQuery is the foundation of our data strategy, serving as the single source of truth for all clinical trial data. It’s a fully-managed, petabyte-scale data warehouse designed for lightning-fast analytics.
-
Function: To store, manage, and serve all structured data related to clinical trials. This could include tables for
trials,sites,patient_enrollment,adverse_events,monitoring_visits, and more. -
Key Features:
-
Serverless: No servers to provision or manage. It scales compute resources automatically based on query demand.
-
Columnar Storage: Data is stored by column, not by row, making it incredibly efficient for analytical queries that aggregate specific fields across millions of records.
-
Standard SQL: Utilizes a familiar SQL dialect, making it accessible to a wide range of developers and data analysts.
-
Performance: Its distributed query engine (Dremel) can scan terabytes of data in seconds, ensuring our Chat App remains responsive even with massive datasets.
Looker Studio: for Comprehensive Visual Dashboards
While the Chat App excels at providing quick, targeted answers to specific questions (“What is the enrollment status of site US-101?”), it’s not designed for high-level, exploratory analysis. That’s where Looker Studio (formerly Data Studio) comes in.
-
Function: Provides a powerful, web-based interface for creating comprehensive and interactive dashboards for macro-level oversight.
-
Use Cases:
-
Visualizing overall trial enrollment progress against targets.
-
Mapping site performance geographically.
-
Creating funnels to track patient screening and randomization rates.
-
Monitoring trends in reported adverse events over time.
-
Integration: Looker Studio connects directly to BigQuery using a native, highly optimized connector. This allows stakeholders to explore the same underlying data as the Chat App but in a much more visual and aggregated format, with dashboards that update in near real-time.
Mapping the Data Journey: From Command to Response
To bring it all together, let’s trace the lifecycle of a single user request from start to finish.
-
Initiation: A Clinical Research Associate (CRA) in a Google Chat space types the command:
/site-enrollment US-101. -
Event Dispatch: Google Chat sends an
INTERACTIONevent payload via HTTPS to the registered webhook URL of our Workspace MCP Server running on Cloud Run. -
Backend Processing: The server receives the request. It parses the JSON to identify the command (
site-enrollment) and the parameter (US-101). -
Query Generation: The application logic constructs a specific SQL query, for example:
SELECT

site_name,

principal_investigator,

status,

patients_screened,

patients_enrolled,

enrollment_target

FROM

`clinical-trials.prod.sites`

WHERE

site_id = 'US-101'

LIMIT 1;
-
Data Execution: The server uses the BigQuery API to execute this query against the
sitestable in our data warehouse. -
Result Retrieval: BigQuery’s engine locates the data and returns the result set (a single row, in this case) to the MCP server in a matter of milliseconds.
-
Response Composition: The server formats this data into a Google Chat Card, creating widgets for the site name, PI, and key metrics, perhaps with a progress bar for enrollment.
-
Final Render: The server sends this card JSON back to the Google Chat API. The API renders the card directly in the CRA’s chat window, providing an immediate, in-context answer to their question.
Step-by-Step Implementation Guide
With the architecture mapped out, let’s dive into the practical implementation. This section provides a detailed walkthrough, from setting up your cloud environment to crafting the final user-facing response cards in Google Chat.
Prerequisites: Setting Up Your Google Cloud and Workspace Environment
Before writing a single line of code, we need to lay the foundation in Google Cloud Platform (GCP) and AC2F Streamline Your Google Drive Workflow. A misconfigured environment is the most common source of issues down the line.
- Google Cloud Project:
- Ensure you have a Google Cloud Project with billing enabled. If not, create one via the GCP Console. All resources—BigQuery datasets, service accounts, and the compute hosting our app—will reside within this project.
- Enable Necessary APIs:
-
APIs are the gateways to Google’s services. For this project, we need to enable the following APIs. You can do this by navigating to “APIs & Services” > “Library” in your GCP console and searching for each one.
-
Google Chat API: Allows your application to receive and send messages and cards.
-
BigQuery API: Grants programmatic access to query your BigQuery data.
-
IAM Service Account Credentials API: Essential for securely managing service account permissions, especially if your compute service needs to impersonate another service account.
- Google Chat apps are part of the Automated Discount Code Management System ecosystem. You’ll need a Workspace account with administrative privileges (or the ability to coordinate with an admin) to install and configure the Chat app for your organization.
- Local Development Toolkit:
-
Install the
gcloudcommand-line interface (CLI) and authenticate it with your account (gcloud auth login). -
Have your preferred code editor (e.g., VS Code) and language environment ready. We’ll be using JSON-to-Video Automated Rendering Engine 3 in our examples, so setting up a virtual environment is highly recommended:
# Create and activate a virtual environment

python3 -m venv .venv

source .venv/bin/activate

# Install required libraries

pip install Flask google-cloud-bigquery
Configuring BigQuery Tables and Service Account Permissions
With the environment ready, let’s prepare our data source and the credentials our application will use to access it.
- Create a BigQuery Dataset and Table:
-
In the BigQuery console, create a new dataset (e.g.,
clinical_trials). -
Within that dataset, create a table to hold your trial monitoring data. For this guide, we’ll use a simple schema. You can create it by running the following SQL query in the BigQuery editor:
CREATE OR REPLACE TABLE `your-gcp-project-id.clinical_trials.enrollment_status` (

trial_id STRING OPTIONS(description="Unique identifier for the clinical trial"),

site_id STRING OPTIONS(description="Identifier for the participating clinical site"),

patient_id STRING OPTIONS(description="Unique identifier for the patient"),

status STRING OPTIONS(description="Current status of the patient, e.g., 'Screening', 'Enrolled', 'Completed'"),

enrollment_date DATE,

data_entry_lag_days INT64 OPTIONS(description="Days between patient visit and data entry")

);
- Remember to replace
your-gcp-project-idwith your actual project ID. After creating the table, load some sample data so you have something to query.
- Create a Dedicated Service Account:
Following the principle of least privilege, we’ll create a new service account that has only* the permissions it needs.
-
Navigate to “IAM & Admin” > “Service Accounts” in the GCP console.
-
Click “Create Service Account”.
-
Give it a name like
chat-bq-monitor-saand a description.
- Grant IAM Permissions:
-
Once the service account is created, you must grant it the necessary roles to interact with BigQuery.
-
BigQuery Job User(roles/bigquery.jobUser): This project-level role allows the service account to execute query jobs. -
BigQuery Data Viewer(roles/bigquery.dataViewer): This role, granted at the dataset level (clinical_trials), allows the service account to read data from the tables within it. -
You can grant these roles using the “IAM” page. Add the newly created service account as a new principal and assign the roles. This separation ensures your app can run queries but cannot modify data or change table schemas.
Developing the Chat App Logic on the MCP Server
This is the core of our application. The “MCP” (Main Compute Platform) server is simply the backend that will receive events from Google Chat, query BigQuery, and send back a formatted response. We’ll use Python and the Flask framework for a lightweight web server.
Let’s create a file named app.py:
import os

from flask import Flask, request, jsonify

from google.cloud import bigquery

from google.oauth2 import service_account

app = Flask(__name__)

# It's best practice to use Application Default Credentials (ADC)

# when running on GCP. For local dev, you can point to a key file.

# os.environ["GOOGLE_APPLICATION_CREDENTIALS"] = "path/to/your/key.json"

bq_client = bigquery.Client()

PROJECT_ID = os.getenv('GCP_PROJECT_ID') # Set this environment variable

# Import your card creation logic (we'll define this later)

from card_designer import create_trial_status_card, create_error_card

@app.route('/', methods=['POST'])

def handle_event():

"""

Main entry point for all Google Chat events.

"""

event_data = request.get_json()

# Handle initial add/remove events

if event_data['type'] == 'ADDED_TO_SPACE':

return jsonify({'text': 'Clinical Trial Monitor added. Use `/trial-status [trial_id]` to get started.'})

elif event_data['type'] == 'REMOVED_FROM_SPACE':

# Clean-up logic could go here

return jsonify({})

# Process slash command interactions

if event_data['type'] == 'MESSAGE' and 'slashCommand' in event_data['message']:

command_id = event_data['message']['slashCommand']['commandId']

# Check if it's the command we care about

if command_id == '1': # The ID we'll configure in the Chat API settings

# Extract the trial ID from the message text

# A simple split; a real app should use more robust parsing

command_text = event_data['message']['argumentText'].strip()

trial_id = command_text if command_text else None

if not trial_id:

return jsonify(create_error_card("Please provide a Trial ID. Usage: `/trial-status NCT12345`"))

try:

# Query BigQuery for the data

query = f"""

SELECT

status,

COUNT(DISTINCT patient_id) AS patient_count,

AVG(data_entry_lag_days) AS avg_lag_days

FROM

`{PROJECT_ID}.clinical_trials.enrollment_status`

WHERE

trial_id = @trial_id

GROUP BY

status

ORDER BY

status;

"""

job_config = bigquery.QueryJobConfig(

query_parameters=[

bigquery.ScalarQueryParameter("trial_id", "STRING", trial_id),

]

)

query_job = bq_client.query(query, job_config=job_config)

results = [dict(row) for row in query_job] # Convert results to a list of dicts

if not results:

return jsonify(create_error_card(f"No data found for Trial ID: {trial_id}"))

# Generate and return the dynamic card

response_card = create_trial_status_card(trial_id, results)

return jsonify(response_card)

except Exception as e:

print(f"An error occurred: {e}")

return jsonify(create_error_card("An internal error occurred while querying the database."))

return jsonify({}) # Default empty response

if __name__ == '__main__':

app.run(host='0.0.0.0', port=int(os.environ.get('PORT', 8080)))
This code sets up a Flask endpoint that listens for POST requests from Google Chat, parses the slash command, and uses a parameterized query (crucial for preventing SQL injection) to fetch data from BigQuery.
Registering the Slash Command and Handling Events
Your server is ready, but Google Chat doesn’t know it exists yet. We need to register it.
-
Navigate to the Google Chat API page in your GCP Console and click the “Configuration” tab.
-
App Information: Fill in the app’s name (e.g., “Clinical Trial Monitor”), a description, and an avatar URL.
-
Interactive Features:
Click to* “Enable interactive features”**.
Under* Slash Commands**, click “Add a slash command”.
-
Configure it as follows:
-
Name:
/trial-status -
Command ID:
1(This must match the ID checked in your Python code). -
Description: “Fetches the current enrollment status for a clinical trial.”
-
Leave “Opens a dialog” unchecked for now.
Click* “Done”**.
- Connection Settings:
Select* “App URL”**.
- Enter the publicly accessible HTTPS URL where your Python app is running. If you’re deploying to a service like Cloud Run, this will be the service URL. For local testing, you can use a tool like
ngrokto create a secure tunnel to your machine.
- Permissions:
- Choose who can install this app. For development, “Specific people and groups” is a good choice. For production, you might make it available to your entire domain.
- Save your configuration. It may take a few minutes for the changes to propagate. You can then add the app to a Google Chat space to begin testing.
Designing Dynamic Response Cards for Data Presentation
Plain text responses are functional but uninspiring. Google Chat’s Card V2 format allows us to present data in a rich, structured, and visually appealing way. We’ll create a separate Python file, card_designer.py, to handle this logic.
# card_designer.py

from datetime import datetime

def create_trial_status_card(trial_id, query_results):

"""

Generates a dynamic card JSON based on BigQuery results.

"""

total_patients = sum(row['patient_count'] for row in query_results)

avg_lag = sum(row['avg_lag_days'] * row['patient_count'] for row in query_results) / total_patients if total_patients > 0 else 0

# Build widgets for each status

status_widgets = []

for row in query_results:

status_widgets.append({

"decoratedText": {

"topLabel": row['status'],

"text": f"<b>{row['patient_count']}</b> Patients",

"startIcon": {

"knownIcon": "PERSON"

}

}

})

card_json = {

"cardsV2": [{

"cardId": "trial_status_card",

"card": {

"header": {

"title": f"Status for Trial {trial_id}",

"subtitle": f"Summary as of {datetime.utcnow().strftime('%Y-%m-%d %H:%M UTC')}",

"imageUrl": "https://www.gstatic.com/images/icons/material/system_gm/2x/analytics_gm_blue_24dp.png",

"imageType": "CIRCLE"

},

"sections": [

{

"header": "Overall Metrics",

"collapsible": False,

"widgets": [

{

"decoratedText": {

"topLabel": "Total Enrolled",

"text": f"<b>{total_patients}</b> Patients",

"startIcon": { "knownIcon": "GROUPS" }

}

},

{

"decoratedText": {

"topLabel": "Avg. Data Lag",

"text": f"<b>{avg_lag:.1f}</b> Days",

"startIcon": { "knownIcon": "CLOCK" }

}

}

]

},

{

"header": "Enrollment by Status",

"collapsible": True,

"widgets": status_widgets

},

{

"widgets": [{

"buttonList": {

"buttons": [{

"text": "Open Full Dashboard",

"onClick": {

"openLink": {

"url": f"https://lookerstudio.google.com/s/your-dashboard-id?params=%7B%22trial_id%22%3A%22{trial_id}%22%7D"

}

}

}]

}

}]

}

]

}

}]

}

return card_json

def create_error_card(message):

"""

Generates a simple card to display an error message.

"""

return {

"cardsV2": [{

"cardId": "error_card",

"card": {

"header": {

"title": "An Error Occurred",

"imageUrl": "https://www.gstatic.com/images/icons/material/system_gm/2x/error_gm_red_24dp.png",

"imageType": "CIRCLE"

},

"sections": [{

"widgets": [{

"textParagraph": {

"text": message

}

}]

}]

}

}]

}
This module contains two functions:
-
create_trial_status_card: Takes thetrial_idand the list of results from BigQuery. It calculates summary statistics and then dynamically builds a series ofdecoratedTextwidgets for each enrollment status. It assembles these into a complete card with a header, multiple sections, and even a button that could link to a more detailed dashboard. -
create_error_card: A utility function to provide consistent and user-friendly error messages directly in Chat, which is a much better user experience than a generic “Something went wrong” failure message.
Strategic Impact and Benefits for Clinical Research
Building a ChatOps-driven clinical trial monitor is more than just a technical exercise in API integration; it’s a strategic move that fundamentally alters how clinical and data teams interact with mission-critical information. By embedding the analytical power of BigQuery directly into the collaborative fabric of Google Chat, we shift the paradigm from reactive, report-based analysis to proactive, conversational data discovery. This approach directly addresses long-standing bottlenecks in clinical operations, unlocking significant gains in speed, efficiency, and decision-making accuracy.
Democratizing Access to Critical Enrollment Data
In a traditional clinical research environment, accessing specific enrollment metrics is often a gated process. A Clinical Research Associate (CRA) or a study manager needing to know the screen failure rate at a specific site must typically file a ticket with a data analytics team, wait for a SQL query to be written and run, and then receive a static report via email. This cycle introduces latency, creates a dependency on a specialized team, and stifles ad-hoc inquiry.
Our Google Chat monitor obliterates this bottleneck. It acts as a self-service data portal, abstracting away the underlying complexity of BigQuery and SQL. Non-technical users can now retrieve powerful insights using simple, natural language commands directly within their primary communication tool.
A command like /enrollment-status --study "PROJ-123" --site "US-04" is no longer just a line of text; it’s an on-demand request for information that is immediately fulfilled. This empowerment is transformative. It frees the data team from a barrage of routine requests, allowing them to focus on more complex, value-added analyses. More importantly, it puts timely, accurate data directly into the hands of the individuals responsible for trial execution, fostering a culture of data-informed action at every level of the organization.
Accelerating Go/No-Go Decisions with Real-Time Insights
The velocity of a clinical trial is dictated by the speed at which its leaders can make informed decisions. Key inflection points—such as activating new sites, modifying inclusion/exclusion criteria, or determining the overall viability of a study arm—depend on having the most current data available. Relying on weekly or even daily static reports means decisions are always based on a lagging view of reality.
This solution provides a direct, real-time conduit to the central data warehouse. When a steering committee is debating whether to close a consistently underperforming site, a project lead can execute a query in the Google Chat space during the meeting to pull the enrollment numbers for the last 24 hours. There is no need to table the discussion or wait for an analyst to “get back to them.”
This immediacy is a competitive advantage. It allows for rapid identification of trends, swift course correction, and confident go/no-go decisions. By collapsing the time between a question being asked and a data-backed answer being provided, teams can operate with a level of agility that was previously impossible, potentially saving millions of dollars and months of trial time.
Improving Collaboration Across Clinical and Data Teams
A persistent challenge in clinical development is the operational and cultural gap between the clinical teams on the ground and the centralized data teams. Communication often flows through formal channels like ticketing systems and email, where context can be lost and misunderstandings can arise.
Integrating data queries into a collaborative platform like Google Chat fundamentally changes this dynamic. The bot becomes a neutral, data-driven participant in the conversation. When a CRA raises a concern about a site’s screening process in a shared space, a colleague or manager can immediately invoke the bot to pull the relevant metrics. The data appears directly in the conversation thread, becoming a shared, immutable point of reference for everyone involved.
This process breaks down silos and fosters a unified, data-driven culture. Speculation is replaced with evidence. Instead of a conversation based on anecdotes (“I feel like site X is struggling”), the dialogue becomes precise and actionable (“The bot shows site X has a screen failure rate 25% higher than the study average. Let’s investigate the primary reason code.”). This creates a powerful feedback loop where clinical observations are instantly validated or challenged by hard data, leading to more effective problem-solving and a stronger, more collaborative partnership between the clinical and data functions of the organization.
Conclusion and Next Steps
We’ve successfully journeyed from a complex problem—accessing vast clinical trial data locked in BigQuery—to an elegant solution: a real-time monitoring tool embedded directly within Google Chat. By bridging the gap between our data warehouse and our primary communication platform, we’ve not only built a powerful utility but also demonstrated a fundamental shift in how clinical research teams can interact with their data.
This architecture is more than just a technical convenience; it’s a catalyst for a more agile, data-driven, and collaborative clinical trial management process. Now, let’s recap what we’ve achieved and explore where you can take this powerful foundation next.
Recap: The Power of Integrating ChatOps into Clinical Research
At its core, this project transformed a passive data repository into an active, conversational partner. We’ve unlocked significant value by:
-
Democratizing Data Access: We’ve empowered stakeholders, from Clinical Research Associates (CRAs) to project managers, to get immediate answers from complex datasets using simple, intuitive chat commands. The dependency on data analysts for routine queries is drastically reduced.
-
Accelerating Decision-Making: By bringing real-time data directly into the conversational flow, we eliminate context switching. A question about patient enrollment at a specific site can be asked and answered in seconds, not hours or days, directly where the team is already collaborating.
-
Enhancing Data Visibility: The barrier to checking on trial progress is now virtually non-existent. This encourages a culture of continuous monitoring and proactive problem-solving, rather than relying on static, periodic reports that may be outdated by the time they are reviewed.
-
Creating a Foundation for [Automated Job Creation in Real Time Jobber and Google Sheets Integration from Gmail](https://votuduc.com/Automated-Job-Creation-in-Jobber-from-Gmail-p115606): The serverless architecture using Cloud Functions, API Gateway, and Pub/Sub is not just efficient—it’s a scalable and extensible platform. We’ve laid the groundwork for far more sophisticated automations and integrations.
Future Potential: Expanding Functionality and Integrations
The solution we’ve built is a powerful starting point. The true potential lies in expanding its capabilities to create a comprehensive clinical operations hub. Here are several exciting avenues for future development:
-
Proactive, Intelligent Alerting: Move beyond on-demand queries to a system that actively monitors your trial. Configure Cloud Scheduler to trigger a Cloud Function that runs daily checks in BigQuery for protocol deviations, slow enrollment rates, or data quality anomalies. When a threshold is met, the system can automatically post a detailed, actionable alert to a designated Google Chat space.
-
Advanced Natural Language Queries: Integrate with Google’s [Building Self Correcting Agentic Workflows with Building Self-Correcting Agentic Workflows with Vertex AI](https://votuduc.com/building-self-correcting-agentic-workflows-with-vertex-ai-p-20260321542526) Agent Builder or other NLP services to move beyond rigid slash commands. Imagine your team being able to ask, “How many patients were enrolled in Germany last week?” or “Show me all serious adverse events for study XYZ-123” in plain English.
-
Richer Data Visualization: Enhance responses by generating and posting simple charts or graphs directly in the chat. A query about enrollment over time could return a line chart image, providing instant visual context. This can be achieved by using a library like Matplotlib in a Cloud Function and posting the generated image.
-
Bi-Directional Integrations: Carefully, and with security as the top priority, introduce write-back capabilities. For example, an alert for a data discrepancy could include a button to “Acknowledge” or “Create Jira Ticket.” Clicking the button would trigger a function that updates a tracking table in BigQuery or calls the Jira API, creating a closed-loop system for issue resolution.
-
Connecting to the Broader Ecosystem: Integrate with other critical systems like your Electronic Data Capture (EDC) or Clinical Trial Management System (CTMS) APIs. This would allow the Chat App to provide a holistic view, correlating operational data with clinical data for even deeper insights.
Scale Your Architecture with Expert Guidance
Moving a proof-of-concept like this into a production environment, especially within the regulated GxP landscape of clinical research, is a significant undertaking. The architecture must be secure, compliant, reliable, and cost-effective at scale.
Key considerations for productionizing this solution include:
-
Security and Compliance: Implementing granular IAM roles, VPC Service Controls, robust audit logging for every query, and a validation strategy that aligns with regulatory requirements.
-
Scalability and Reliability: Designing for failure with sophisticated error handling, retries, and monitoring through the Google Cloud Operations Suite to ensure the service is always available.
-
Cost Optimization: Fine-tuning BigQuery queries, implementing partitioning and clustering strategies, and setting up granular billing alerts to manage operational costs effectively.
Building a validated, enterprise-grade solution requires a deep understanding of both the Google Cloud platform and the unique challenges of the life sciences domain. If you’re ready to transform this concept into a mission-critical tool that accelerates your clinical development pipeline, our team has the expertise to guide you through every step of the process.


Stop Doing Manual Work. Scale with AI.
Want to turn these blog concepts into production-ready reality for your team?
Table Of Contents
Portfolios
Related Posts
Quick Links
Legal Stuff